Forex Market Learning Index
Structured educational pathway from global macroeconomic fundamentals to institutional interbank price action.
Foundation & Chart Analysis
5 ModulesForex Market Basics
Currency pairs, exchange rates & pips
Candlestick Patterns
Pin bars, morning stars & rejection candles
Chart Patterns
Channels, double bottoms & flag breakouts
Market Analysis
Central banks, interest rates & technicals
Support & Resistance
Key psychological exchange rate barriers
Currency Derivatives & Interbank Flow
4 ModulesForex Chart Geometry & Breakout Dynamics
Trade with the institutional RBC principle (Reversal, Breakout, Continuation) across global currency pairs. Calculate measured move pip objectives, session overlap expansion rules, and invalidation stop levels.
Pattern Geometry & Measured Move Calculator
 Structure Geometry
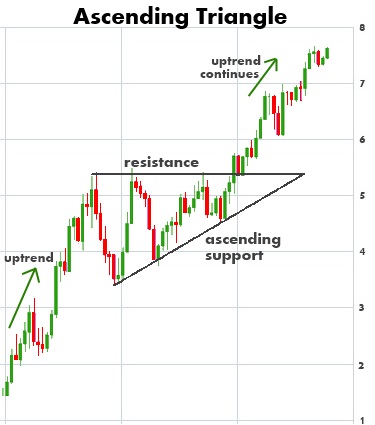
Ascending Triangle Pattern
A horizontal upper resistance line connecting equal swing highs and an ascending lower trendline connecting higher swing lows. Price compresses with declining volume before an explosive upward breakout.
Volume contracts progressively during compression, then expands by at least 150%+ on the breakout candle.
Measure the vertical distance of the triangle at its widest opening and project that upward from the breakout point.
The RBC Institutional Framework
Classifying currency pairs into three distinct macro liquidity regimes
Central Bank Exhaustion & Pivots
Formations that mark cyclical macro tops or bottoms (e.g., Double Tops on EUR/USD at major 1.10 resistance). Sovereign reserve managers and commercial hedgers absorb remaining retail liquidity.
Consolidation Release
When an Asian session range tightens into a symmetrical triangle or wedge, the London 07:00 GMT open unlocks institutional order flow, producing high-velocity directional pip expansion.
Macro Trend Rest & Momentum
Shallow counter-trend flags and pennants in strongly trending pairs (e.g., Bull Flag on USD/JPY during interest rate divergence). High statistical win-rates with tight invalidation thresholds.
Complete Pattern Repository
Displaying 12 institutional chart structures.
Ascending Triangle Pattern
A horizontal upper resistance line connecting equal swing highs and an ascending lower trendline connecting higher swing lows. Price compresses with declining volume before an explosive upward breakout.
Volume contracts progressively during compression, then expands by at least 150%+ on the breakout candle.
Measure the vertical distance of the triangle at its widest opening and project that upward from the breakout point.
Descending Triangle Pattern
A flat horizontal support floor paired with a declining upper trendline connecting lower swing highs. Buyers weaken as sellers establish lower peaks, leading to an eventual high-volume breakdown.
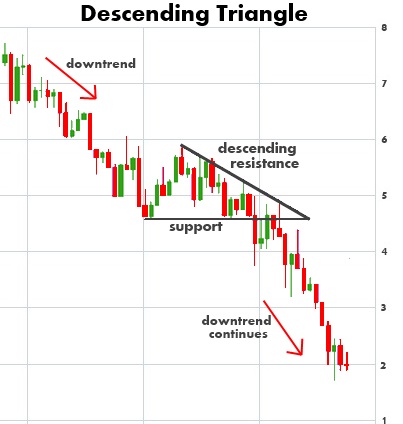
Volume typically dries up as price approaches the apex, followed by a surge of liquidation volume on breakdown.
Measure the height of the back of the triangle and project downward from the support breakdown line.
Bullish Flag Pattern
An impulsive upward move (the flagpole) followed by a short-term downward sloping parallel consolidation channel (the flag) on diminished volume. Upper breakout resumes the trend with equal vigor.
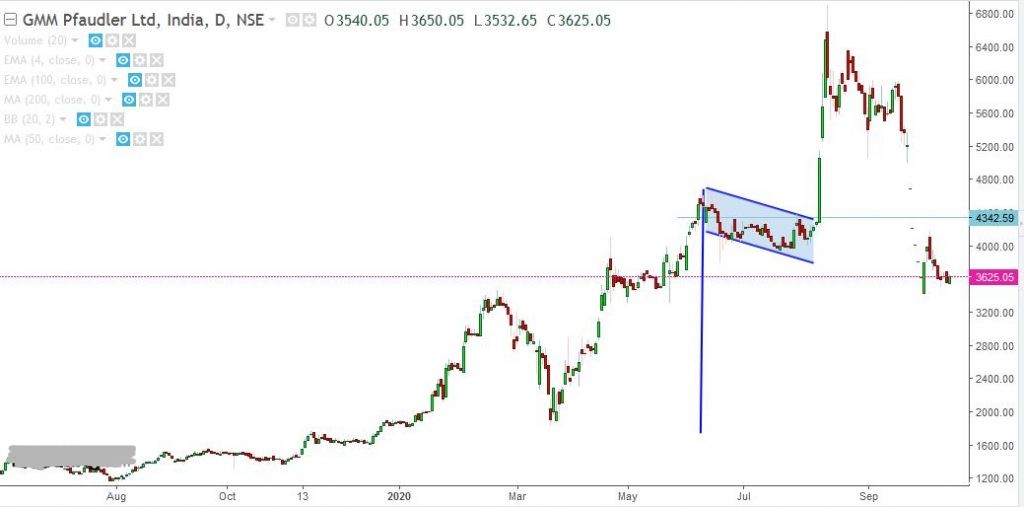
Heavy volume on the pole, light volume during flag drift, and a sharp spike when the upper trendline is cleared.
Project the full height of the flagpole from the lowest point of the flag consolidation.
Bearish Flag Pattern
The inverse of the bull flag. An aggressive downward selloff succeeded by a shallow upward-drifting counter-trend consolidation. Breakdown below the lower flag line triggers a rapid drop.
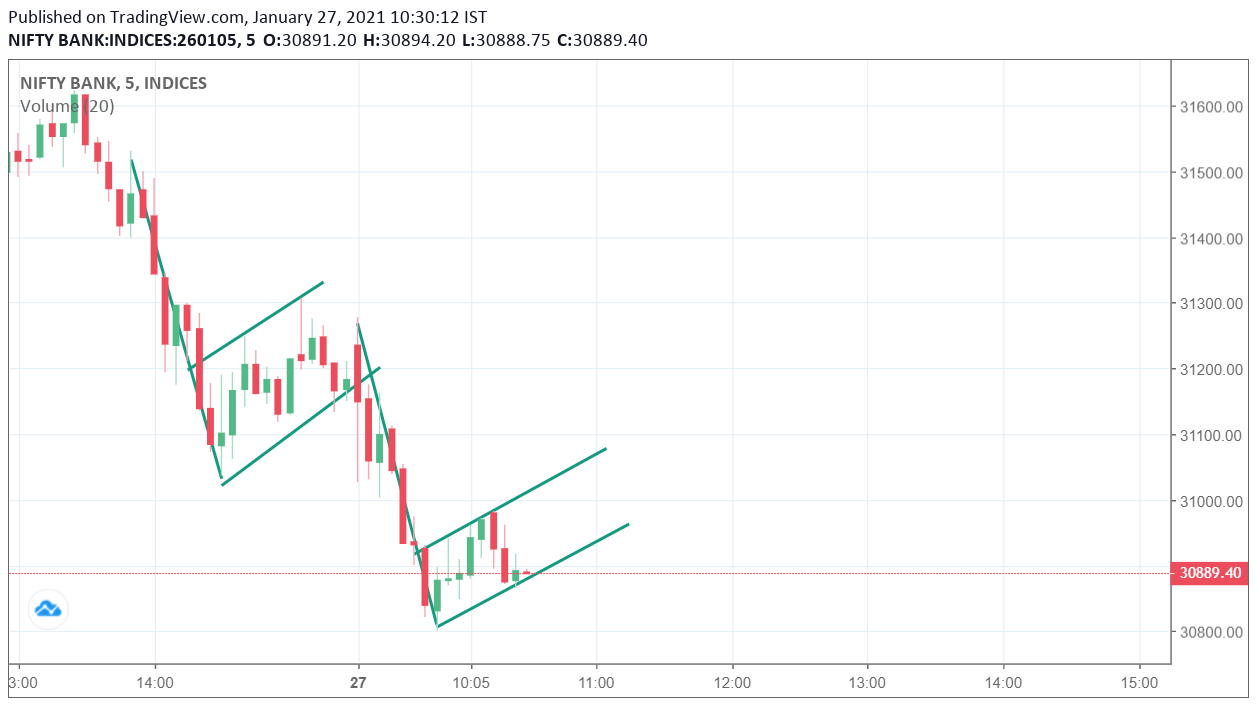
High selling volume on the drop, declining volume on the bounce, high volume on the breakdown.
Project the length of the downward flagpole from the highest point of the flag consolidation.
Bullish Falling Wedge
Price contracts inside converging downward-sloping trendlines. Lower lows are printed, but at a diminishing pace compared to lower highs, indicating gradual seller exhaustion.
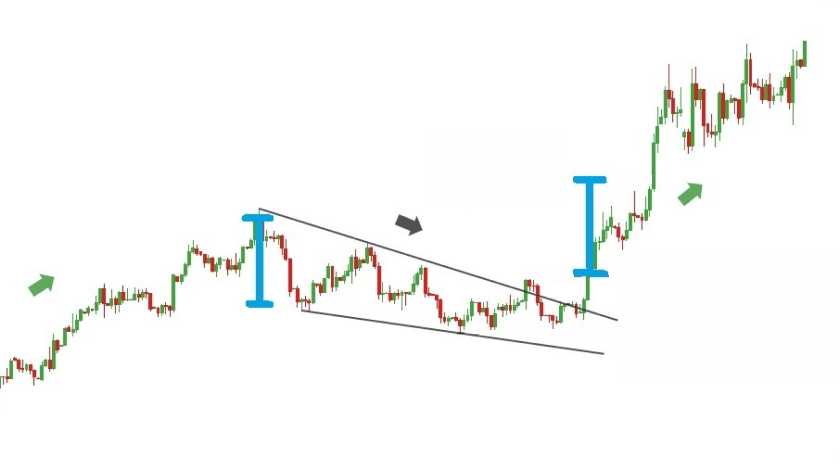
Volume steadily decreases as the wedge tightens and expands substantially on upper breakout.
Initial target is the origin of the wedge (the swing high from which the pattern originated).
Bearish Rising Wedge
Forms within converging upward-sloping trendlines where both highs and lows are rising, but buyer momentum is steadily diminishing. Precedes a sharp downward breakdown.
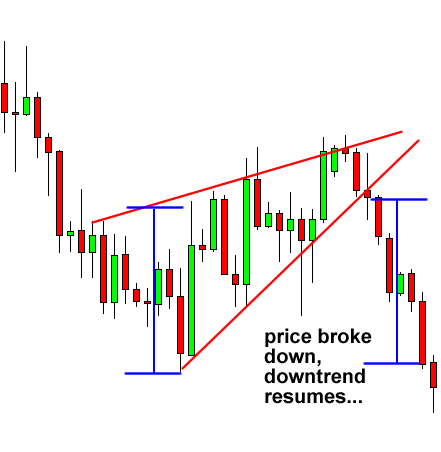
Volume tends to fall as prices climb into the wedge apex, signaling exhaustion of institutional demand.
Project to the base of the wedge where the lowest swing low started.
Double Top (M Pattern)
Price tests a prominent resistance barrier twice without penetrating. The confirmation trigger is a decisive close below the intervening valley (the neckline).
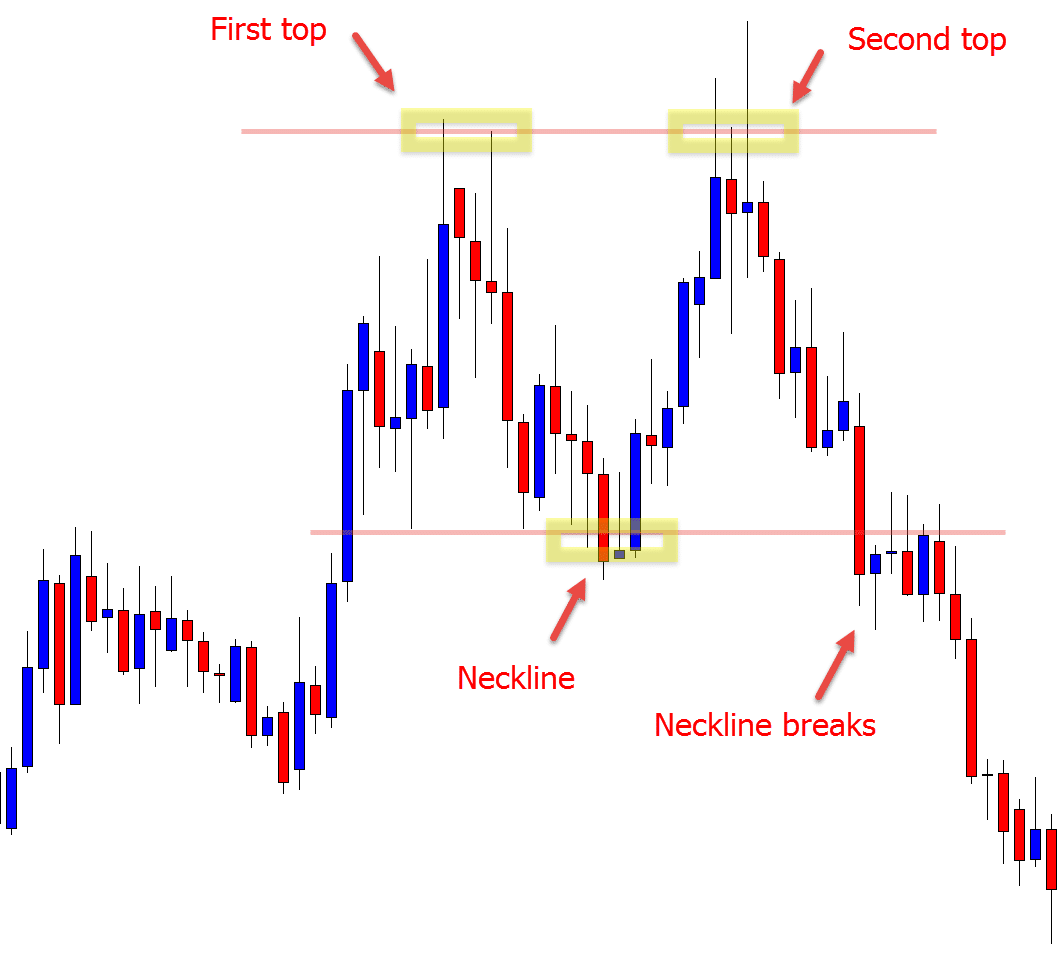
Peak two typically prints on noticeably lighter volume than peak one, demonstrating lack of follow-through.
Measure from the peak of the tops to the neckline, and project that distance down from the neckline breakdown.
Double Bottom (W Pattern)
Forms when price bounces off an identical support floor twice. The confirmation trigger is a decisive close above the intervening peak (neckline), initiating a fresh upward cycle.
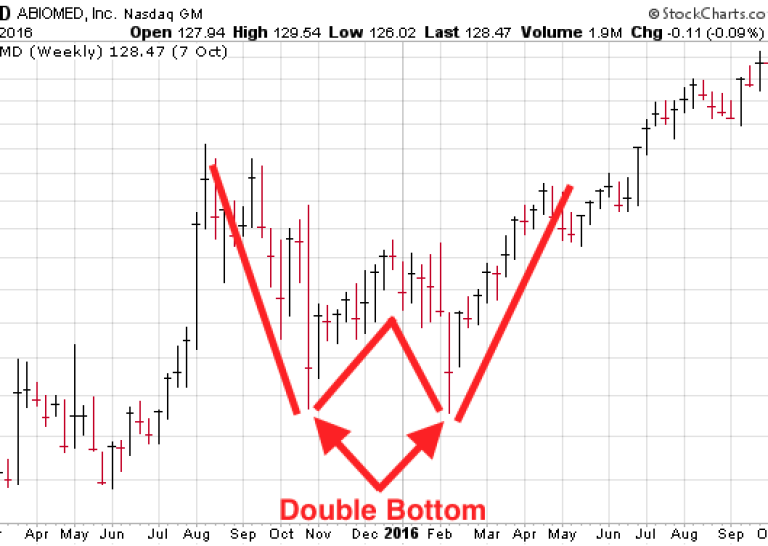
Second bottom bounce usually brings expanding volume that peaks as the neckline is cleared.
Measure height from trough to neckline and project upward from the neckline breakout.
Triple Top Pattern
A rarer, more reliable top reversal where price fails to pierce resistance three distinct times. Volume consistently diminishes on each successive peak.
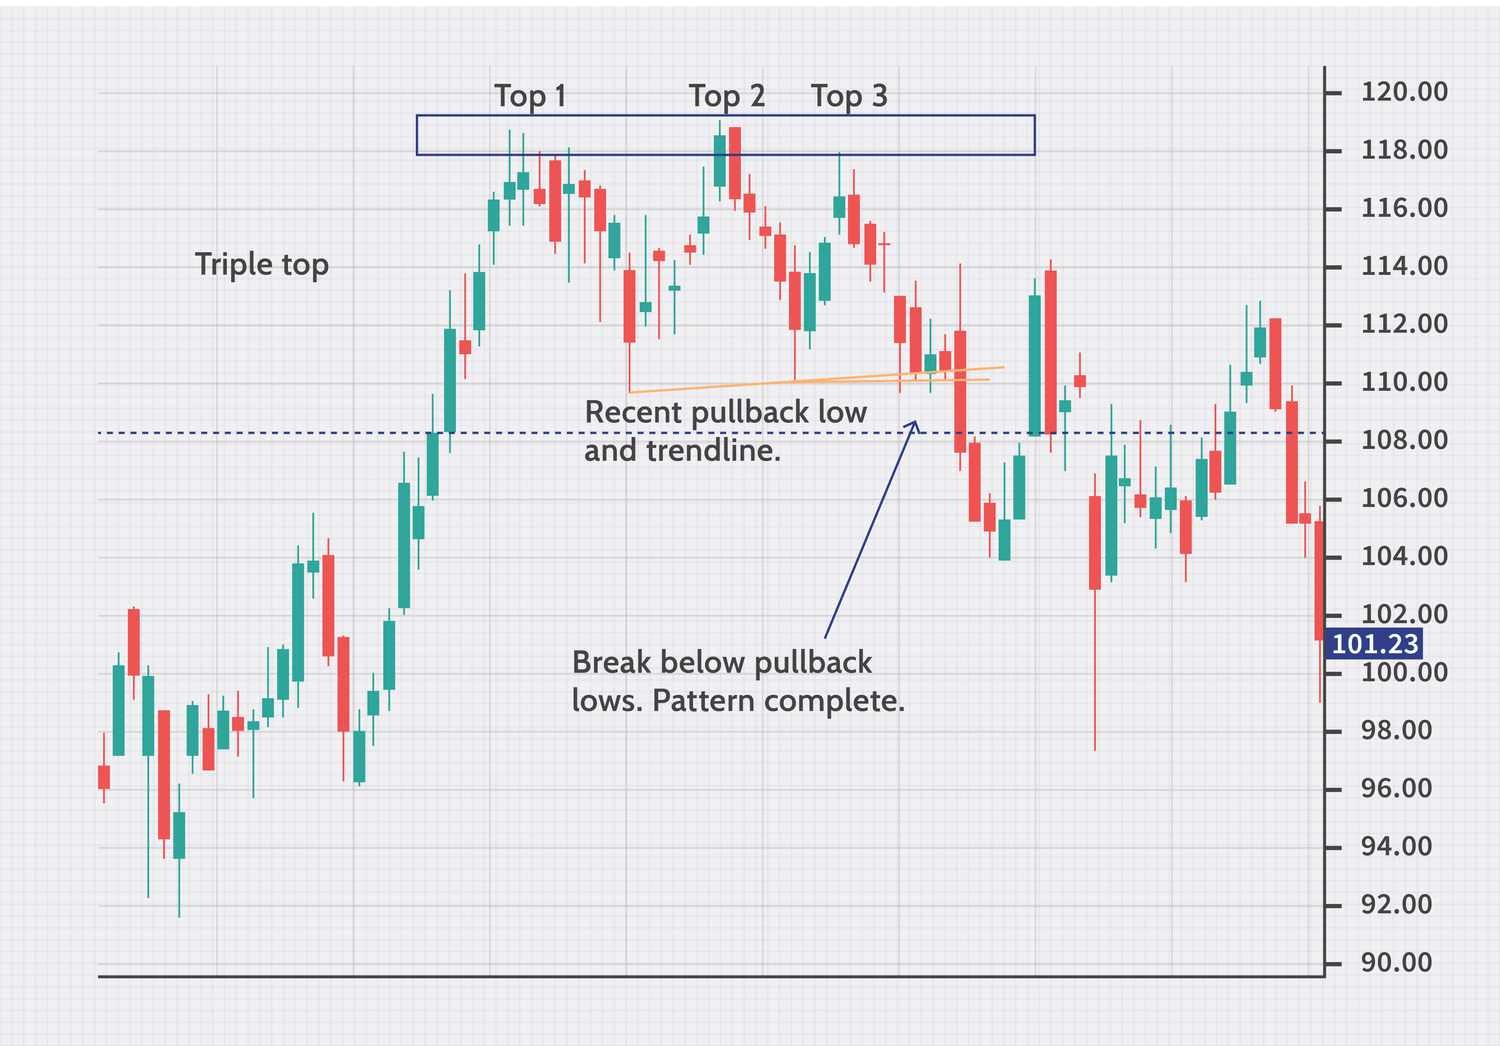
Progressively diminishing volume across peaks 1, 2, and 3, followed by a volume surge on breakdown.
Measure the height between the peak ceiling and valley floor, projected downward from the break point.
Triple Bottom Pattern
Mirror of the triple top. Bulls defend a clear support barrier across three separate tests. Volume expands noticeably as the third bounce clears upper resistance.
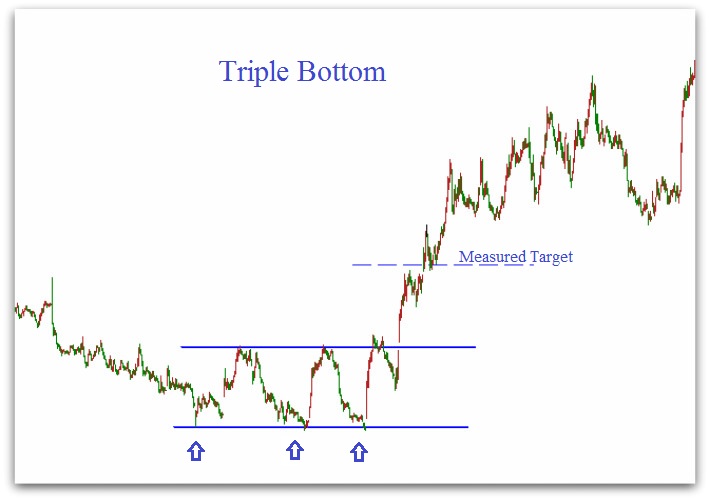
Low volume on test three, surging volume on the neckline breakout.
Height of the formation projected upward from the breakout neckline.
Head & Shoulders Pattern
One of the most revered technical formations: a left shoulder peak, a higher head peak, and a lower right shoulder peak connected by a neckline. Neckline breakdown signals major regime change.
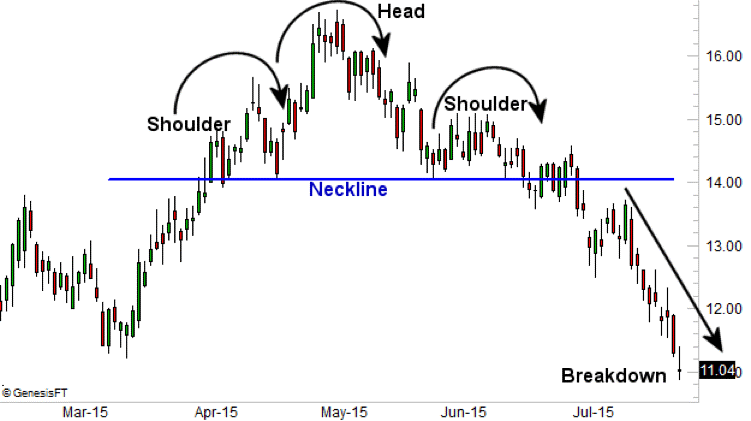
Left shoulder has highest volume; head has moderate volume; right shoulder has very low volume. Neckline break brings heavy volume.
Measure the vertical distance from the top of the head down to the neckline, and project that distance down from the breakdown point.
Inverse Head & Shoulders
Appears at major cyclical bottoms: a left trough, a lower head trough, and a higher right trough. The neckline breakout confirms transition from supply domination to active institutional accumulation.
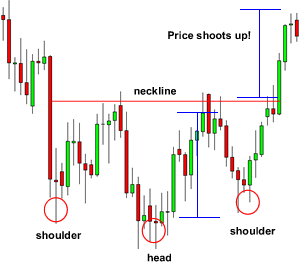
Right shoulder forms on drying volume; neckline breakout is fueled by aggressive volume expansion.
Measure depth from the bottom of the head up to the neckline, and project upward from the breakout point.
Forex Breakout Caveats & Interbank Traps
Managing news whipsaws, pip slippage, and central bank intervention
Tier-1 Economic Releases (NFP/CPI)
Geometrical patterns formed prior to Tier-1 releases often get violently blown out in both directions within 60 seconds as bank algos clear liquidity pools. Never enter inside the 5-minute pre-announcement window.
Session Timing Confluence
Breakouts that materialize during the quiet Asian session have a 65% failure rate compared to breakouts that occur during the London (07:00-11:00 GMT) or NY open (12:30-16:00 GMT).
Spread Expansion Buffers
Always add a 3 to 5 pip buffer outside the geometrical neckline or trendline for your stop loss to prevent getting tagged by widening broker spreads during the 17:00 EST rollover.
The Triple Confluence Rule
High probability FX trades require three aligned factors: 1) Clean Chart Geometry, 2) Candlestick Wick Rejection at the breakout test, and 3) Alignment with the HTF currency pair trend.