
Forex Market Learning Index
Complete guide to master forex market trading
Foundation Concepts
Advanced Trading
Candlestick Patterns Mastery
Complete guide to understanding and trading with candlestick patterns
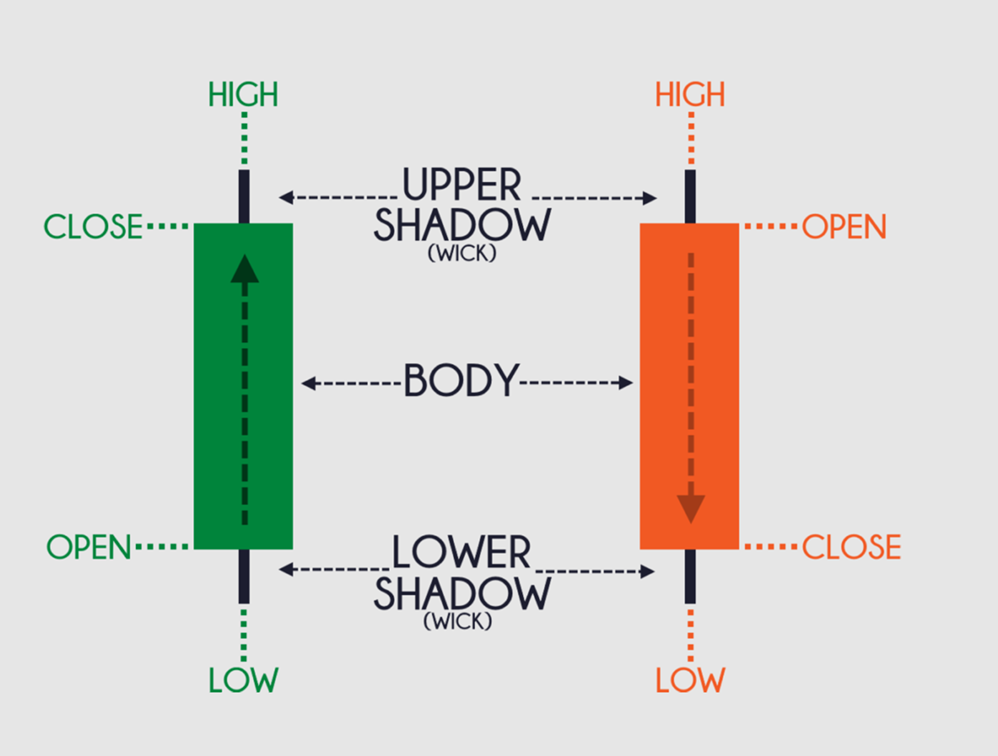
Candlesticks are a way of displaying information about an asset's price movement. These are visual representations that show the opening, closing, highest, and lowest prices during a specific time frame.
Types of Candlesticks
Green Candlestick
Indicates bullish sentiment - closing price higher than opening price
Red Candlestick
Indicates bearish sentiment - closing price lower than opening price
How to Read Candlestick Patterns
A candlestick pattern shows four key pieces of information: the opening price, closing price, highest price, and lowest price during the period.
Patterns can be single candlesticks or combinations of multiple candlesticks, each providing unique insights into market psychology and potential price movements.
Best Timeframes for Trading
There isn't a one-size-fits-all answer because the best timeframe depends on your trading style:
- Day Trading: 1-minute, 5-minute, or 15-minute charts
- Swing Trading: Daily or weekly charts for longer-term trends
Choose a timeframe that aligns with how quickly you want to enter and exit trades.
Market Conditions
Candlestick patterns are most effective in:
- Trending Markets: Strong uptrends or downtrends
- Clear Direction: Patterns help confirm trend strength
In choppy or sideways markets, patterns might give mixed signals and be less reliable.
Combining Candlesticks with Technical Indicators
Candlestick patterns provide visual cues about potential market movements, but adding other indicators can help confirm these patterns and give you more confidence in your trading decisions.
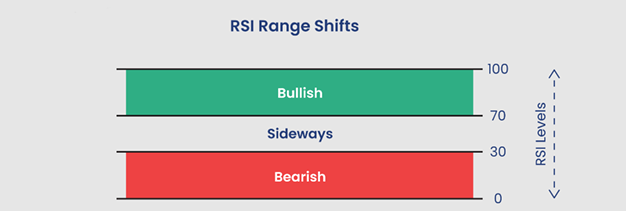
Relative Strength Index (RSI)
The RSI measures the speed and change of price movements. If a bullish candlestick pattern forms when RSI is below 30 (oversold), it could signal a powerful reversal upward.
Volume Indicators
Pair patterns with volume indicators like OBV or VWAP. A bullish pattern with surge in volume indicates genuine buying interest.
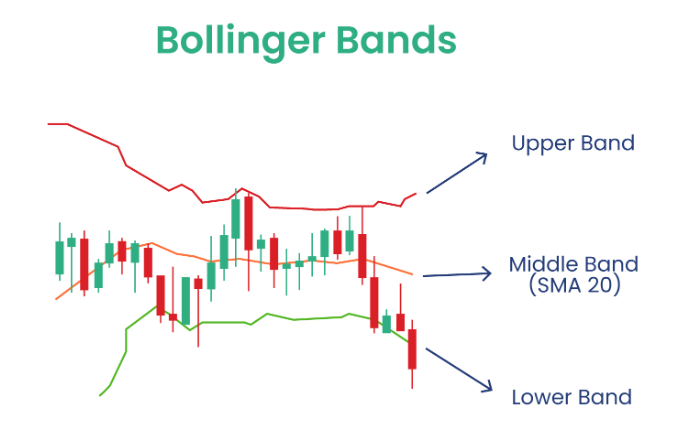
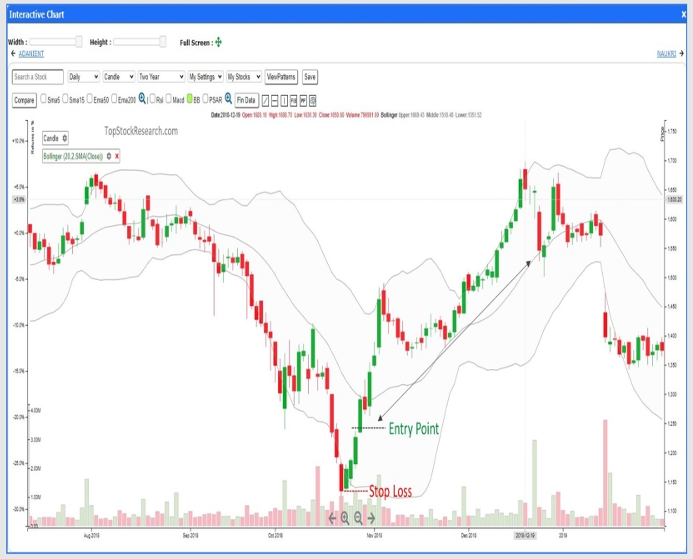
Bollinger Bands
Help understand price volatility. Patterns near upper or lower bands may suggest potential reversals.
Types of Candlestick Patterns
Traders rely on candlestick patterns because they provide a popular way to quickly interpret price information. These are categorized into 3 types:
1. Bullish Patterns
Signify that after these patterns the market may show upward trend
2. Bearish Patterns
Signify that after these patterns the market may show downward trend
3. Continuation Patterns
Signify that the current price trend is likely to continue
Bullish Candlestick Patterns
Bullish candlestick patterns suggest a potential reversal from downtrend to uptrend or continuation of uptrend. These patterns indicate buying pressure is overcoming selling pressure, leading to potential price rises.
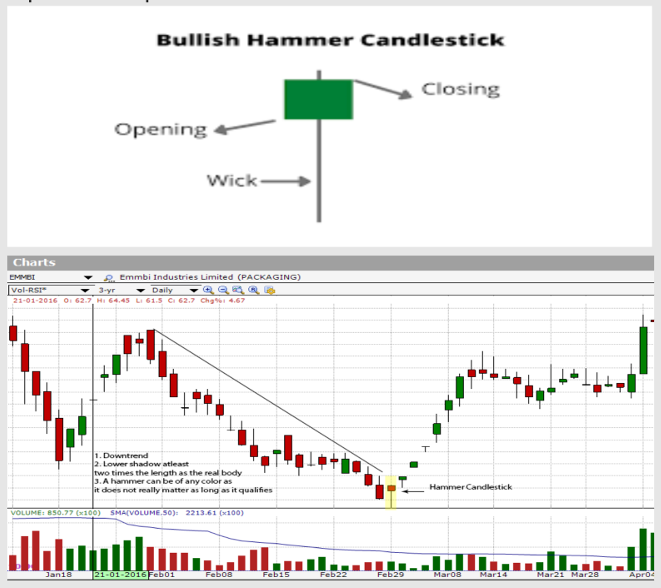
1. Hammer Pattern
Signal: Bullish Pattern
The hammer is a bullish reversal pattern that forms after a downtrend. It is characterized by a small body near the top of the candlestick with a long lower wick. This indicates that despite selling pressure driving the price down, buyers stepped in to push the price back up. The implication is that the downtrend may be nearing its end, and a potential uptrend could follow.
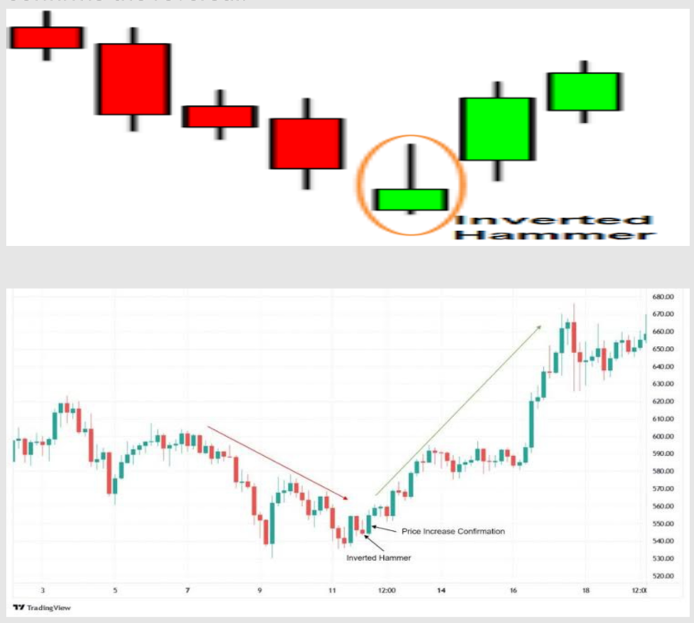
2. Inverted Hammer Pattern
Signal: Bullish Pattern
The inverted hammer is a bullish reversal pattern that appears after a downtrend. It has a small body, a long upper wick, and little to no lower wick. This indicates that buyers attempted to push the price higher but met resistance. The following bullish candlestick confirms the reversal.
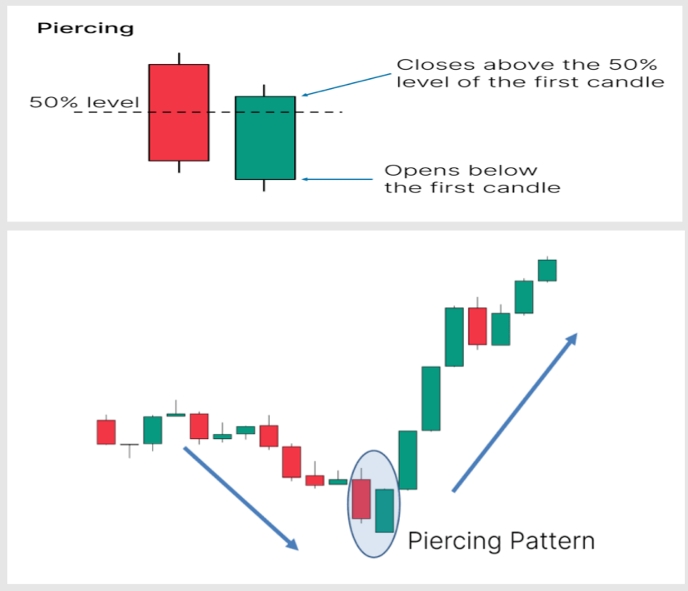
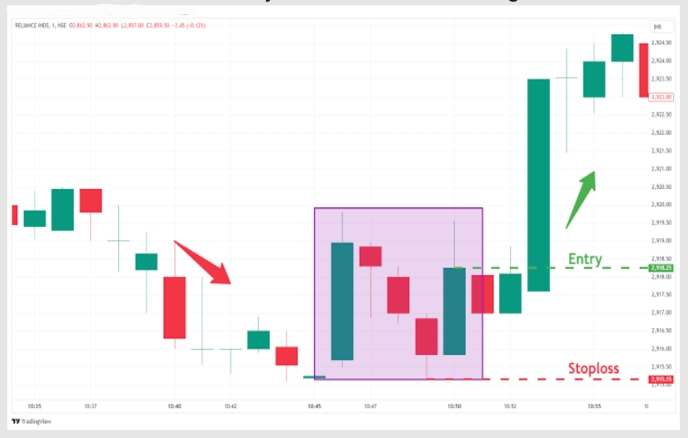
3. Piercing Line Pattern
Signal: Bullish Pattern
The piercing line pattern is a two-candlestick formation signaling a potential bullish reversal. It occurs in a downtrend, with the first candlestick being bearish and followed by a bullish candlestick that opens lower but closes above the midpoint of the previous candlestick. This pattern suggests a strong shift in market sentiment from bearish to bullish.
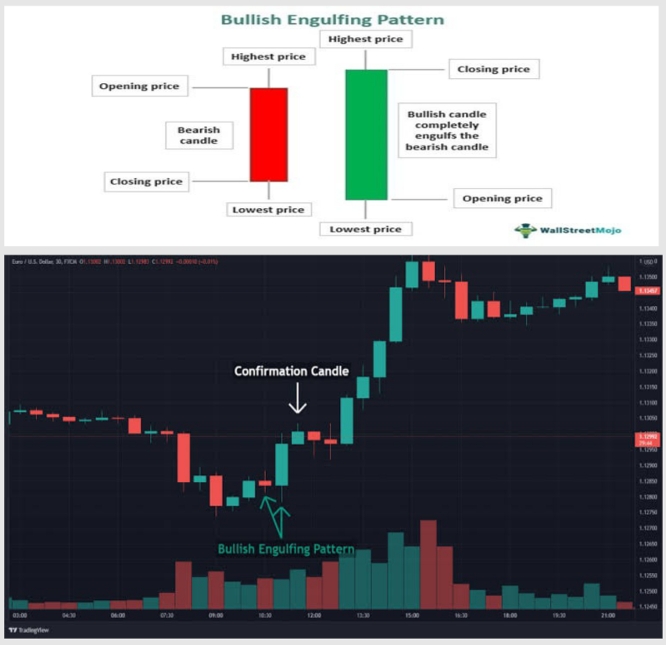
4. Bullish Engulfing Pattern
Signal: Bullish Pattern
The bullish engulfing pattern is a reversal signal. It consists of a small bearish candlestick followed by a larger bullish candlestick that completely engulfs the previous one. This indicates that buyers have taken control, overpowering the sellers, and suggests a potential upward movement.
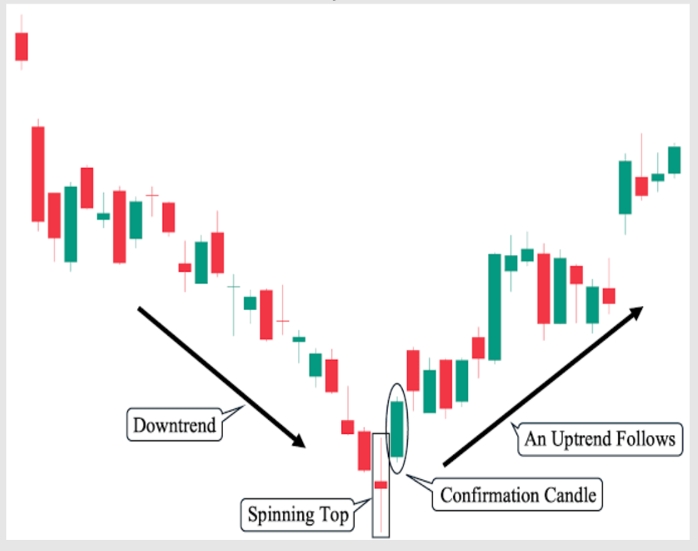
5. Bullish Spinning Top Pattern
Signal: Bullish Pattern
A bullish spinning top is characterized by a small body and long wicks on both sides. It indicates indecision in the market, with both buyers and sellers unable to gain the upper hand. When it appears after a downtrend, it suggests that selling pressure is weakening and that a bullish reversal may be imminent.
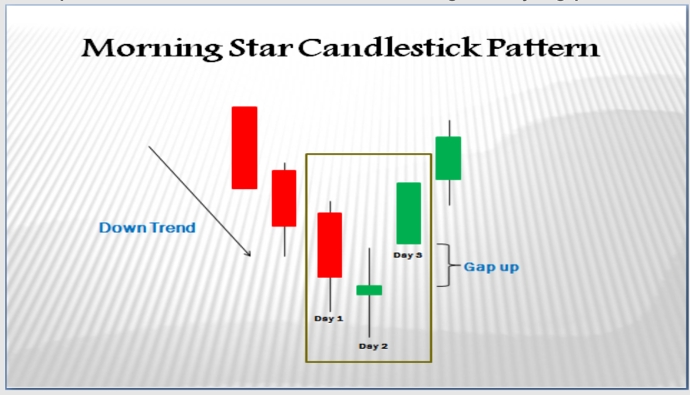
6. The Morning Star Pattern
Signal: Bullish Pattern
The morning star is a three-candlestick pattern that signals a bullish reversal. It's characterized by the following: Starts with a long, bearish candlestick. Followed by a small-bodied candlestick (the star) that gaps down. Ends with a long bullish candlestick that closes near the midpoint of the first candlestick. This pattern indicates a shift from selling to buying pressure.
7. Three White Soldiers Pattern
Signal: Bullish Pattern
The three white soldiers pattern consists of three consecutive long bullish candlesticks with small or no wicks. Each candlestick opens within the previous body and closes at or near its high, indicating strong buying pressure and the potential start of a sustained uptrend.
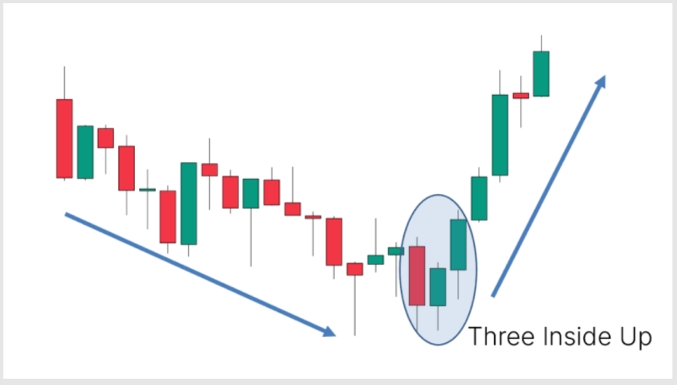
8. Three Inside Up Pattern
Signal: Bullish Pattern
The three-inside-up pattern is a bullish reversal signal formed by three candlesticks. The first is a long, bearish candlestick. Followed by a smaller bullish candlestick that forms within the first one body. And a third bullish candlestick that closes above the first ones high. This indicates a shift in momentum from bearish to bullish.
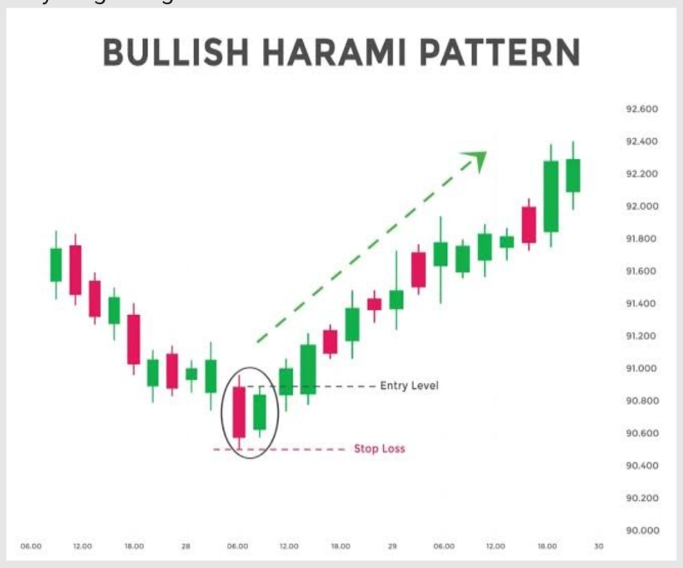
9. Bullish Harami Pattern
Signal: Bullish Pattern
The bullish harami is a two-candlestick pattern indicating a potential reversal. It occurs when a small bullish candlestick forms within the body of a preceding large bearish candlestick. This suggests that selling pressure is weakening, and buyers may be gaining control.
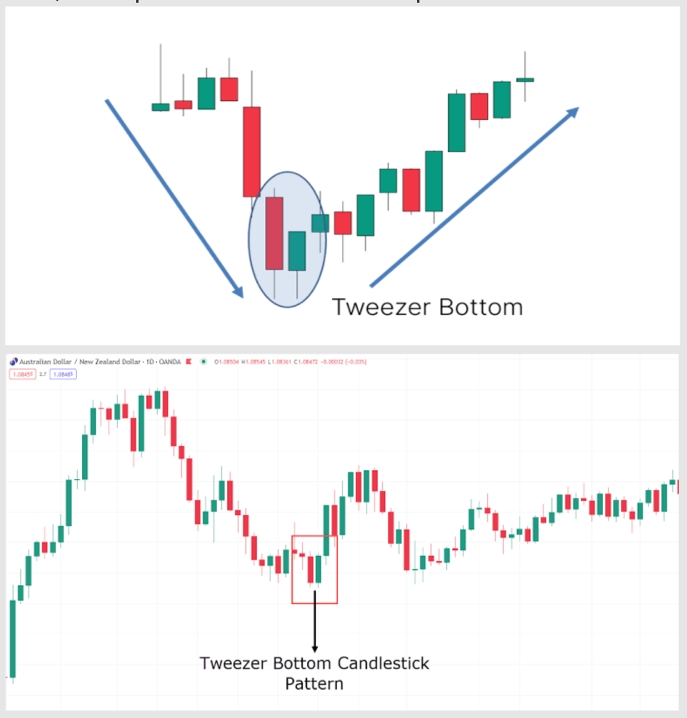
10. Tweezer Bottom Pattern
Signal: Bullish Pattern
A tweezer bottom is a bullish reversal pattern formed by two candlesticks with matching lows. It indicates that the downtrend has found a strong support level, and a potential reversal to the upside could follow.
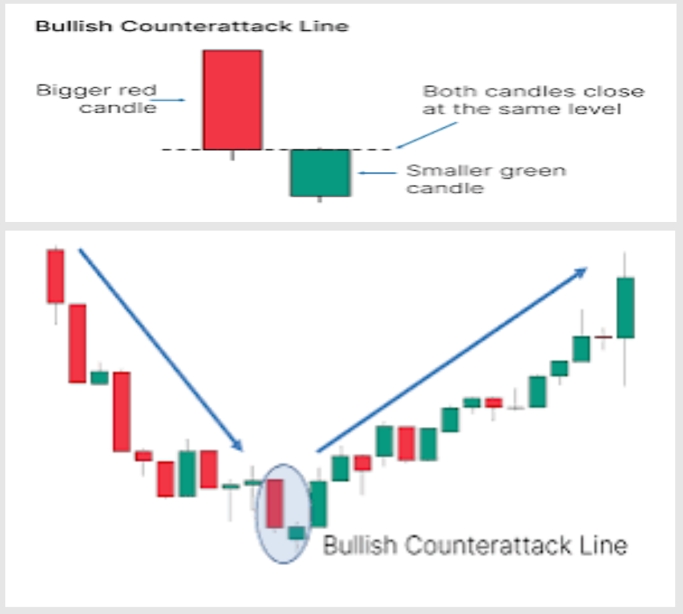
11. Bullish Counterattack Pattern
Signal: Bullish Pattern
The bullish counterattack pattern consists of a bearish candlestick followed by a bullish candlestick that opens lower but closes at the same level as the previous candlesticks close. This indicates that buyers have countered the selling pressure, potentially leading to a reversal.
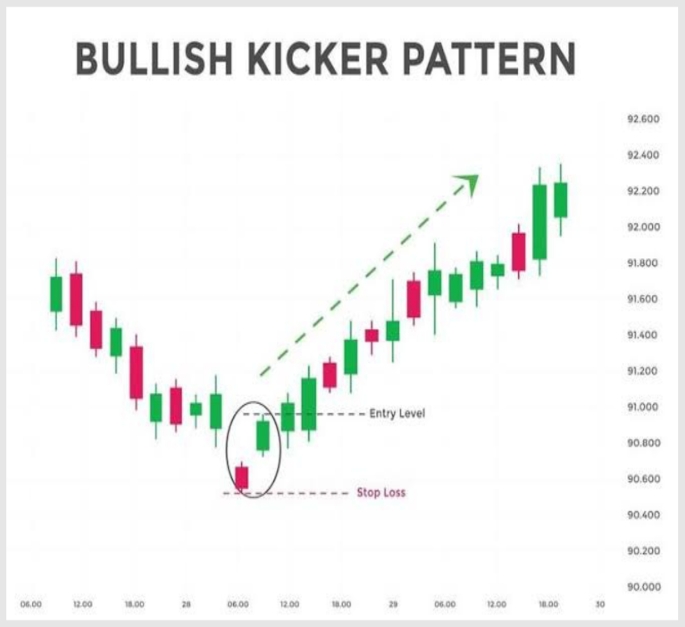
12. Bullish Kicker Pattern
Signal: Bullish Pattern
The bullish kicker pattern is a strong reversal signal. It starts with a bearish candlestick followed by a bullish candlestick that opens above the previous close and continues to move higher. This pattern shows a significant shift in market sentiment from bearish to bullish.
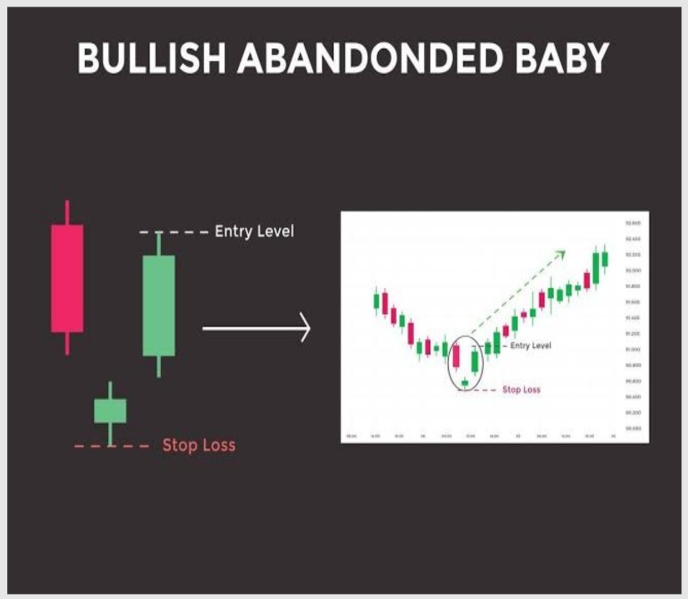
13. Bullish Abandoned Baby Pattern
Signal: Bullish Pattern
The bullish abandoned baby is a rare three-candlestick pattern indicating a reversal. It consists of a long bearish candlestick, a doji that gaps down, and a long bullish candlestick that gaps up. This pattern suggests a strong shift in market sentiment from bearish to bullish.
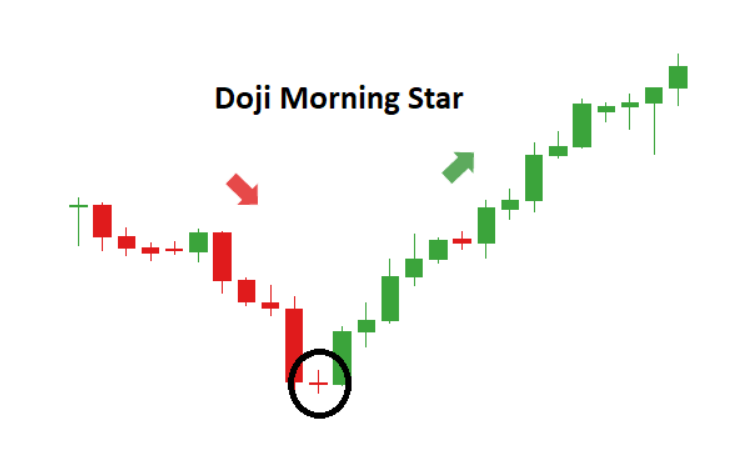
14. Morning Star Doji Pattern
Signal: Bullish Pattern
The morning star doji is similar to the morning star pattern but features a doji as the middle candlestick. The doji indicates indecision in the market, and the following bullish candlestick confirms the reversal. This pattern signals a shift from selling to buying pressure.
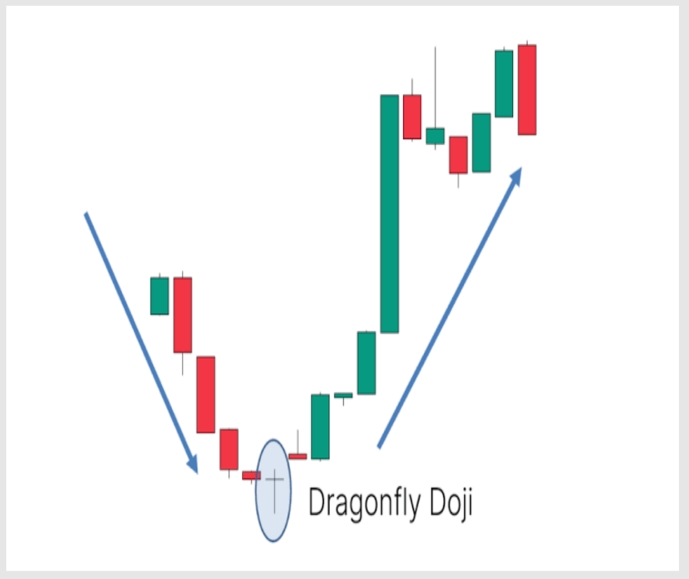
15. Dragonfly Doji Pattern
Signal: Bullish Pattern
A dragonfly doji is a bullish reversal pattern that appears at the bottom of a downtrend. It has a small body at the top with a long lower wick, indicating that despite selling pressure, buyers pushed the price up significantly during the session. This pattern suggests that the downtrend may be nearing its end.
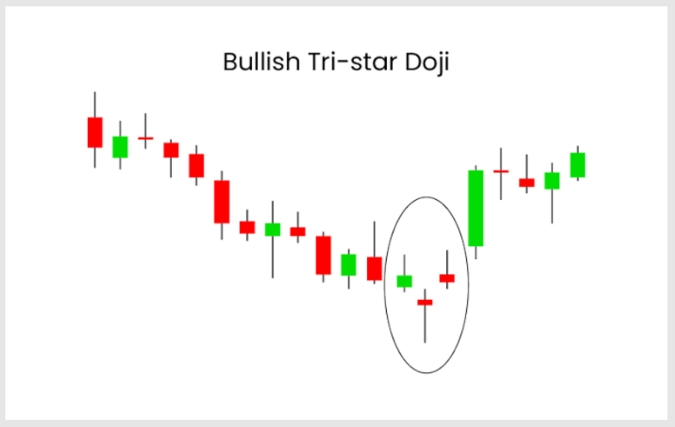
16. Bullish Tri-Star Pattern
Signal: Bullish Pattern
The bullish tri-star is a rare candlestick pattern that signals a potential reversal from a downtrend to an uptrend. It consists of three doji candles in a row, with the middle doji forming at the lowest point of the pattern. This formation indicates that the market is experiencing indecision after a period of selling pressure. When the bullish tri-star appears at the bottom of a downtrend, it suggests that the selling pressure may be exhausted, and buyers could start to take control. This pattern often points to a possible upward movement in the market, signaling that a new uptrend may be on the horizon.
17. Bullish Hikkake Pattern
Signal: Bullish Pattern
The Bullish Hikkake is a bullish reversal pattern that often emerges in a bearish market or downtrend. It starts with an inside bar, where the price action is contained within the previous candle, signaling consolidation or indecision in the market. The subsequent candle breaks out in the opposite direction, creating a false move that traps sellers. However, the market quickly reverses, and a strong bullish move follows, indicating that buyers have regained control. This pattern is valuable for traders looking to capitalize on market reversals, especially when it occurs near key support levels or is confirmed by an increase in trading volume.
18. Concealing Baby Swallow Pattern
Signal: Bullish Pattern
The Concealing Baby Swallow is a rare and complex pattern that forms during a downtrend and signals a potential bullish reversal. It consists of four candles, all of which are bearish. The first two being long bearish candles followed by a third bearish candle that is completely engulfed by the fourth bearish candle. The final candle opens lower and closes higher, indicating that the bearish momentum has weakened, and a reversal might be on the horizon. Traders interpret this pattern as a sign of selling exhaustion and the possibility of a new upward move, making it a critical signal for those looking to catch a reversal in a downtrend.
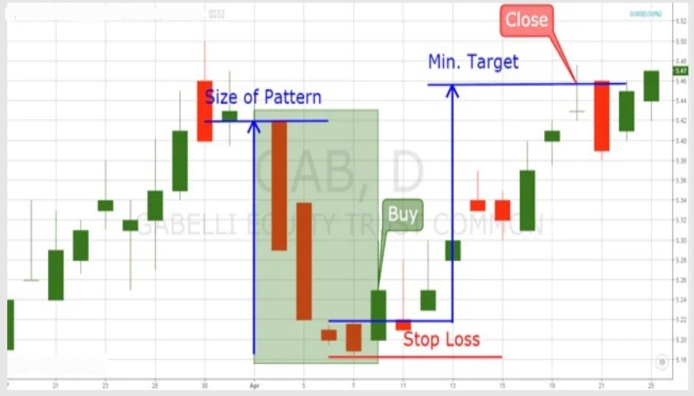
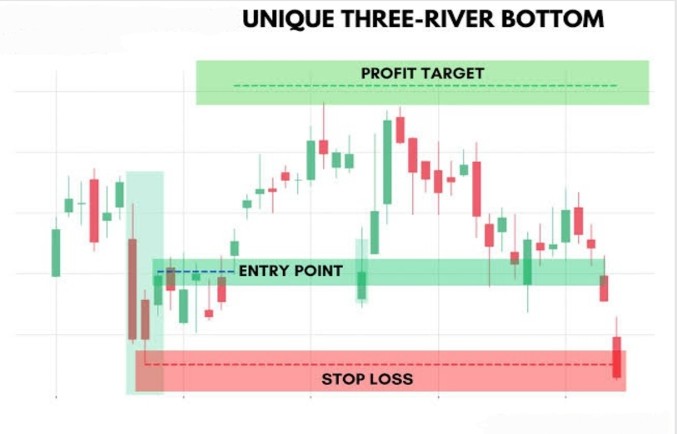
19. Unique Three Rivers Pattern
Signal: Bullish Pattern
The Unique Three Rivers pattern is a bullish reversal signal that forms after a downtrend, indicating that the market might be ready to turn upward. It consists of three candles: the first is a long bearish candle, followed by a second candle with a long lower shadow, reflecting buying pressure. The third candle is a small bullish or neutral candle, showing indecision in the market. This pattern suggests that the downward momentum is weakening, and buyers are starting to step in. While the Unique Three Rivers pattern is not very common, it is a reliable indicator of a potential trend reversal when confirmed by other technical signals.
Bearish Candlestick Patterns
Bearish candlestick patterns suggest potential reversal from uptrend to downtrend or continuation of downtrend. These patterns indicate selling pressure is overcoming buying pressure, leading to potential price decline.
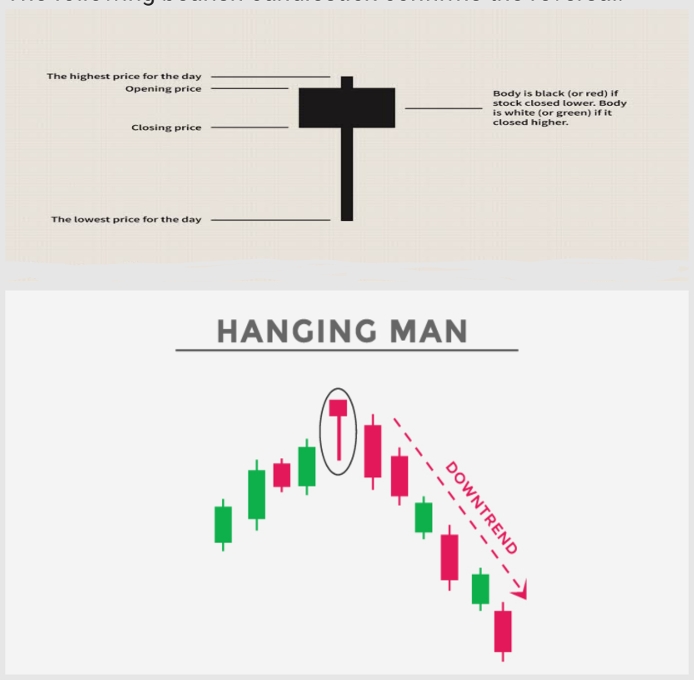
20. Hanging Man Pattern
Signal: Bearish Pattern
The hanging man is a bearish reversal pattern that appears after an uptrend. It has a small body at the top with a long lower wick, indicating that despite buying pressure, sellers pushed the price down significantly during the session. The following bearish candlestick confirms the reversal.
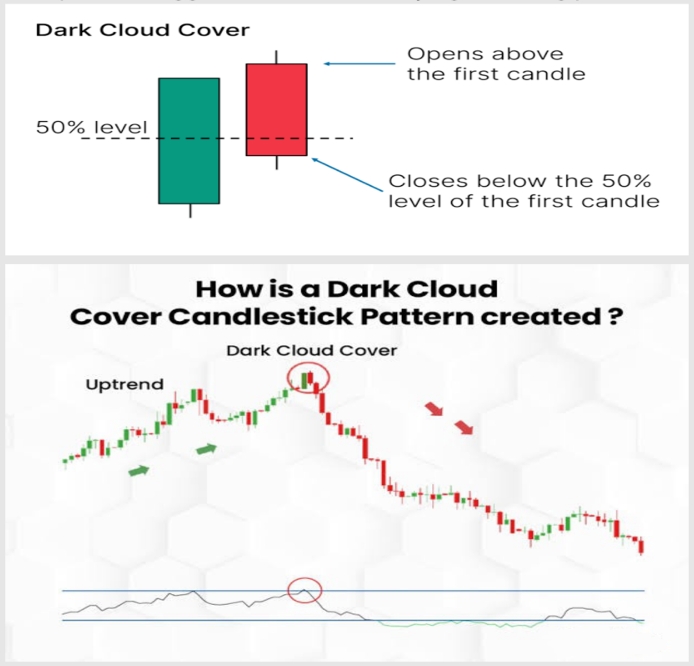
21. Dark Cloud Cover Pattern
Signal: Bearish Pattern
The dark cloud cover is a two-candlestick pattern, indicating a bearish reversal. It occurs in an uptrend where: the first candlestick is bullish followed by a bearish candlestick that opens higher but closes below the midpoint of the previous candlestick. This pattern suggests a shift from buying to selling pressure.
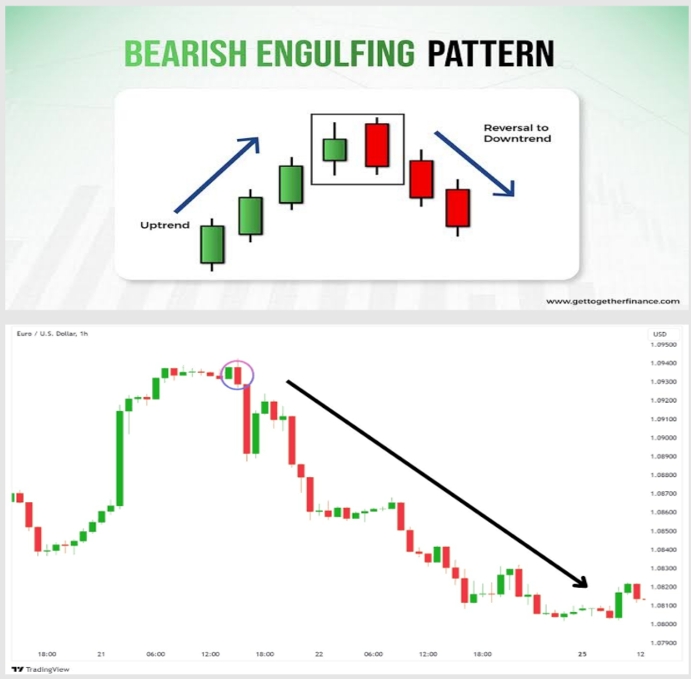
22. Bearish Engulfing Pattern
Signal: Bearish Pattern
The bearish engulfing pattern is a strong reversal signal. It consists of a small bullish candlestick followed by a larger bearish candlestick that completely engulfs the previous one. This indicates that sellers have taken control, overpowering the buyers, and suggests a potential downward movement.
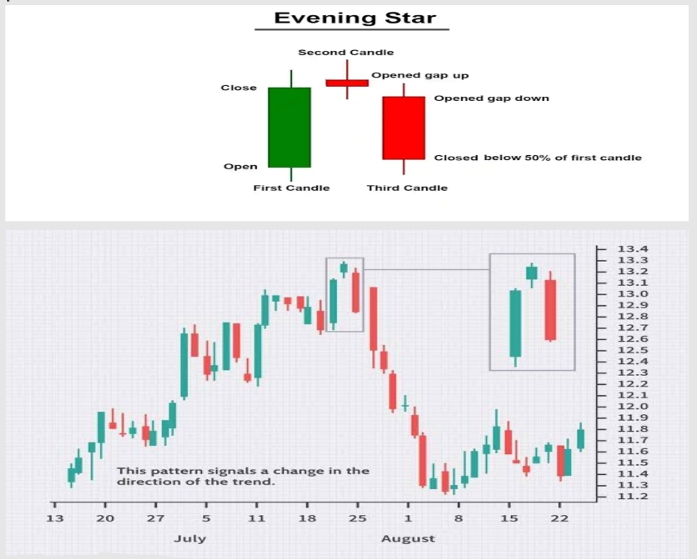
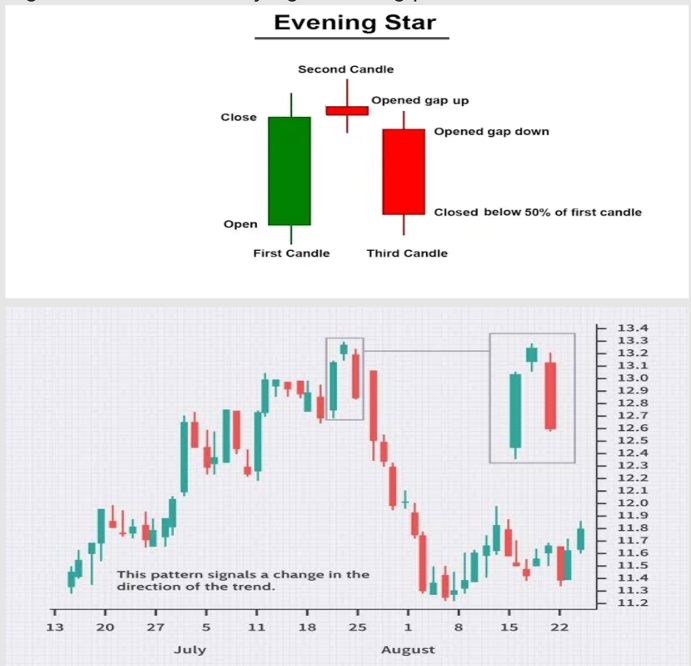
23. The Evening Star Pattern
Signal: Bearish Pattern
The evening star is a three-candlestick pattern that signals a bearish reversal. It's characterized by the following: starts with a long, bullish candlestick followed by a small-bodied candlestick (the star) that gaps up and ends with a long, bearish candlestick that closes near the midpoint of the first candlestick. This pattern indicates a shift from buying to selling pressure.
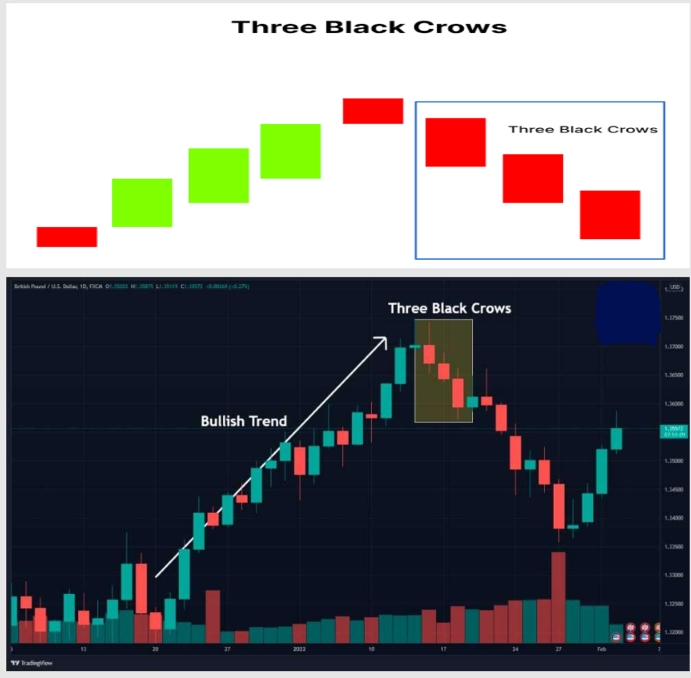
24. Three Black Crows Pattern
Signal: Bearish Pattern
The three black crows pattern consists of three consecutive long bearish candlesticks with small or no wicks. Each candlestick opens within the previous body and closes at or near its low, indicating strong selling pressure and the potential start of a sustained downtrend.
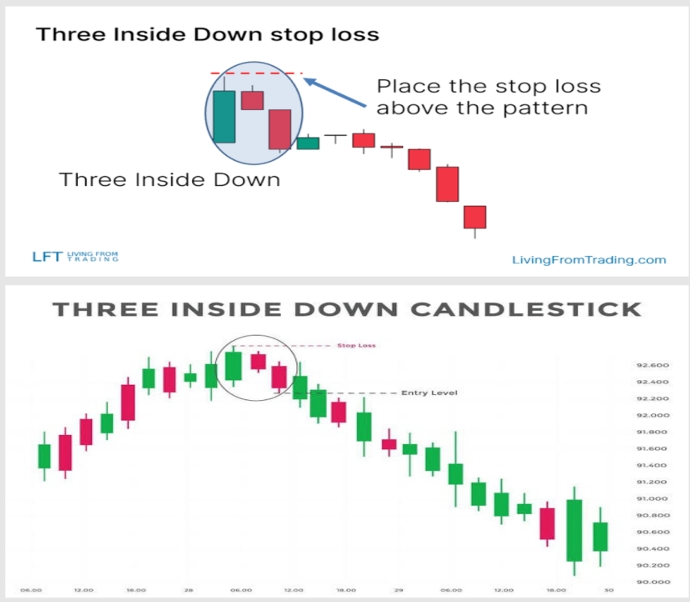
25. Three Inside Down Pattern
Signal: Bearish Pattern
The three-inside-down pattern is a bearish reversal signal formed by three candlesticks. The first is a long, bullish candlestick. Followed by a smaller bearish candlestick that forms within the first ones body. And a third bearish candlestick that closes below the first ones low. This indicates a shift in momentum from bullish to bearish.
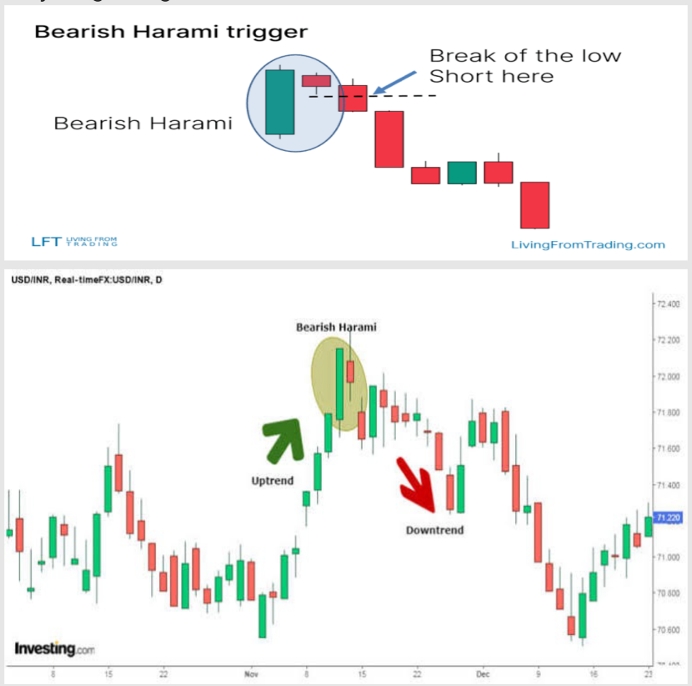
26. Bearish Harami Pattern
Signal: Bearish Pattern
The bearish harami is a two-candlestick pattern indicating a potential reversal. It occurs when a small bearish candlestick forms within the body of a preceding large bullish candlestick. This suggests that buying pressure is weakening, and sellers may be gaining control.
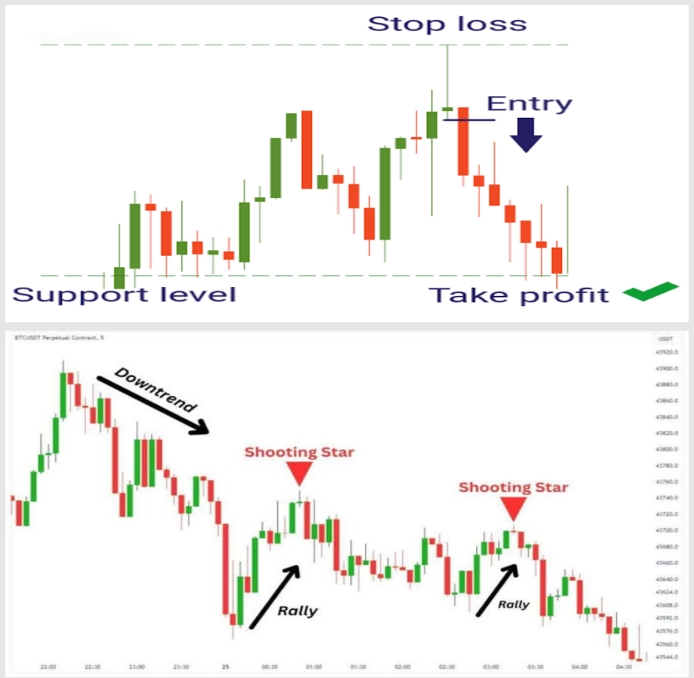
27. Shooting Star Pattern
Signal: Bearish Pattern
The shooting star is a bearish reversal pattern that appears after an uptrend. It has a small body, a long upper wick, and little to no lower wick. This indicates that buyers attempted to push the price higher but met resistance. The following bearish candlestick confirms the reversal.
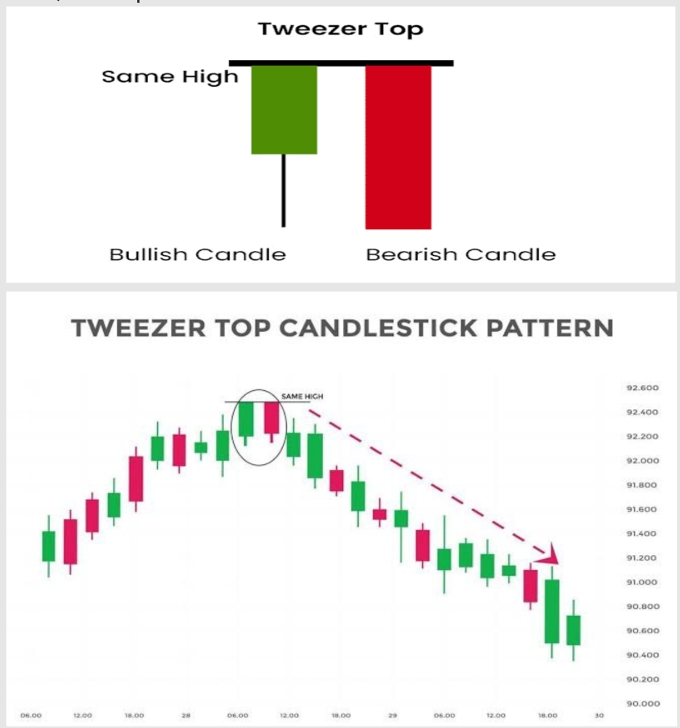
28. Tweezer Top Pattern
Signal: Bearish Pattern
A tweezer top is a bearish reversal pattern formed by two candlesticks with matching highs. It indicates that the uptrend has found a strong resistance level, and a potential reversal to the downside could follow.
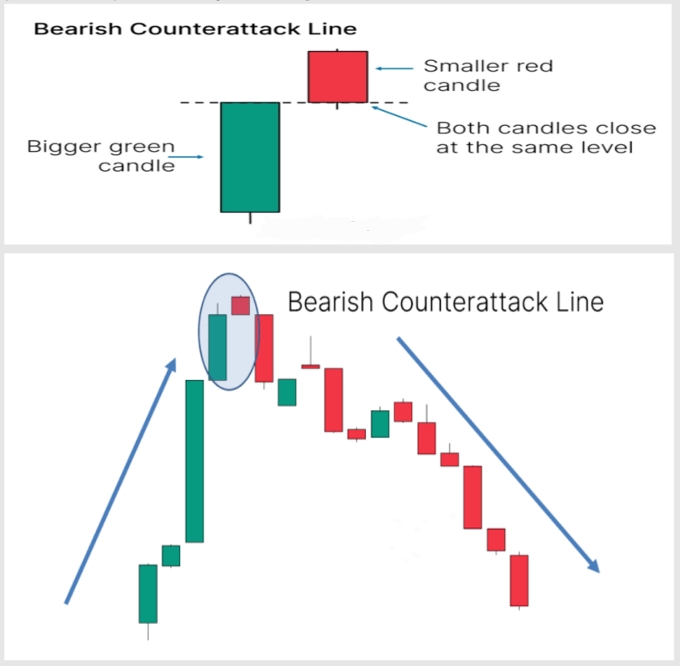
29. Bearish Counterattack Pattern
Signal: Bearish Pattern
The bearish counterattack pattern consists of a bullish candlestick followed by a bearish candlestick that opens higher but closes at the same level as the previous candlesticks close. This indicates that sellers have countered the buying pressure, potentially leading to a reversal.
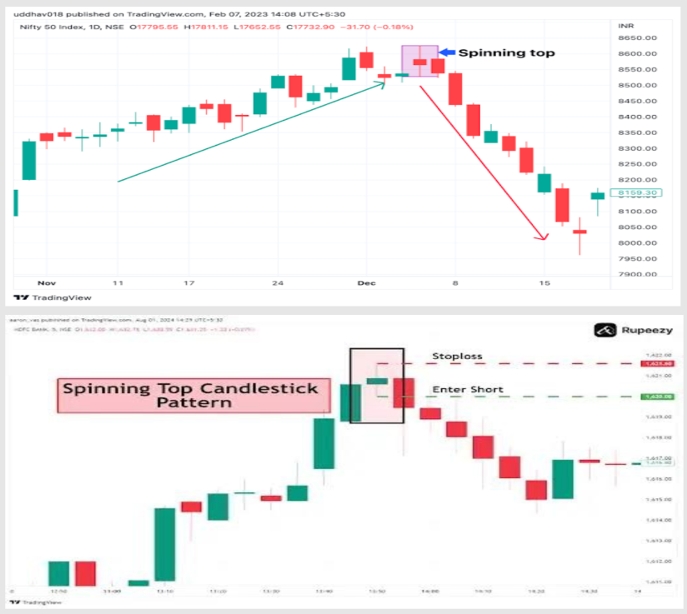
30. Bearish Spinning Top Pattern
Signal: Bearish Pattern
A bearish spinning top is characterized by a small body and long wicks on both sides. It indicates indecision in the market, with both buyers and sellers unable to gain the upper hand. When it appears after an uptrend, it suggests that buying pressure is weakening and that a bearish reversal may be imminent.
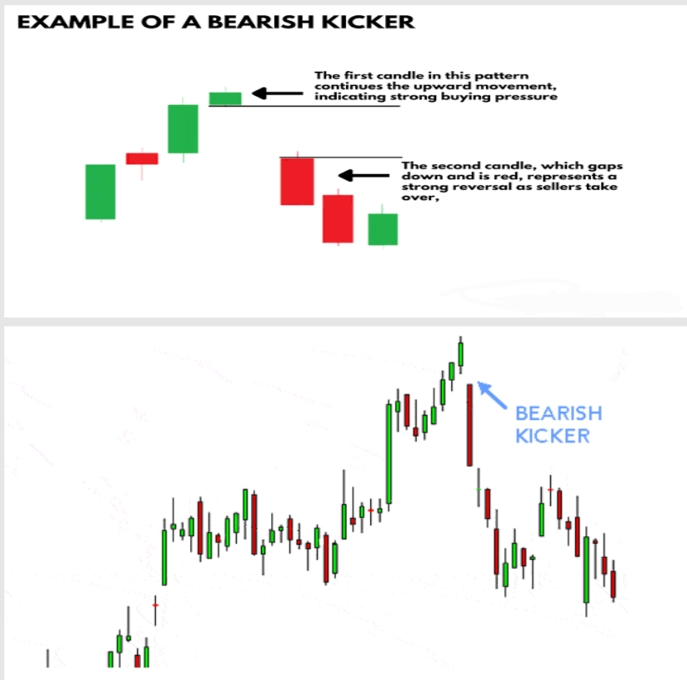
31. Bearish Kicker Pattern
Signal: Bearish Pattern
The bearish kicker pattern is a strong reversal signal. It starts with a bullish candlestick followed by a bearish candlestick that opens below the previous close and moves lower. This pattern shows a significant shift in market sentiment from bullish to bearish.
32. Evening Star Doji Pattern
Signal: Bearish Pattern
The evening star doji is similar to the evening star pattern but features a doji as the middle candlestick. The doji indicates indecision in the market, and the following bearish candlestick confirms the reversal. This pattern signals a shift from buying to selling pressure.
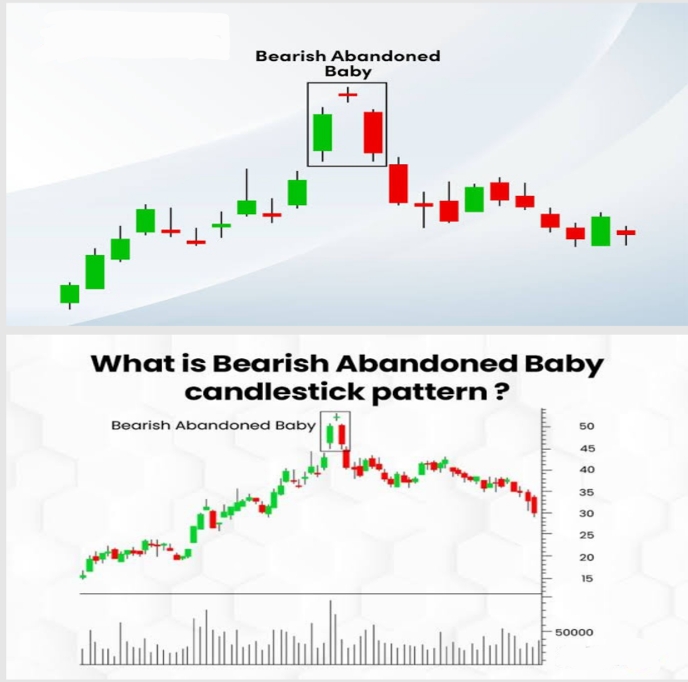
33. Bearish Abandoned Baby Pattern
Signal: Bearish Pattern
The bearish abandoned baby is a three-candlestick pattern indicating a reversal. It consists of a long bullish candlestick, a doji that gaps up, and a long bearish candlestick that gaps down. This pattern suggests a strong shift in market sentiment from bullish to bearish.
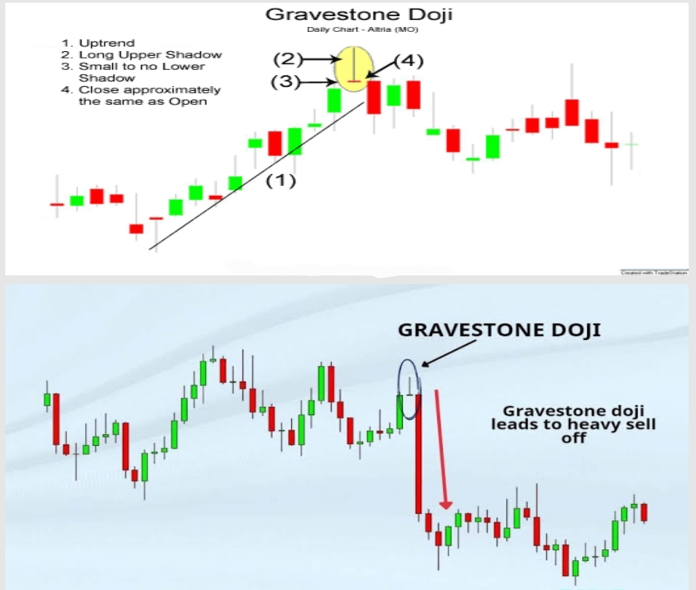
34. Gravestone Doji Pattern
Signal: Bearish Pattern
A gravestone doji is a bearish reversal candlestick pattern that appears at the top of an uptrend. It has a small body at the bottom with a long upper wick, indicating that despite buying pressure, sellers pushed the price down significantly during the session. This pattern suggests that the uptrend may be nearing its end.
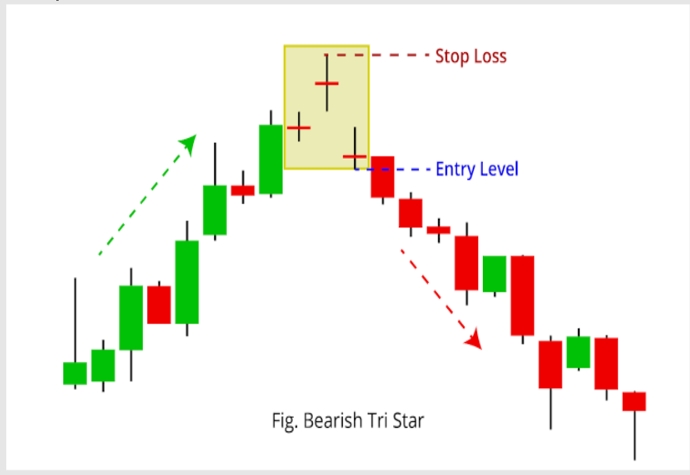
35. Bearish Tri-Star Pattern
Signal: Bearish Pattern
The bearish tri-star is another rare candlestick pattern that hints at a potential market reversal, but this time from an uptrend to a downtrend. Just like the bullish tri-star, this pattern consists of three doji candles in a row, with the middle one marking the peak of the pattern. When the bearish tri-star forms at the top of an uptrend, it reflects market indecision and a possible loss of buying strength. This pattern suggests that the upward momentum could be fading, and sellers might be preparing to take control, leading to a possible downward move in the market.
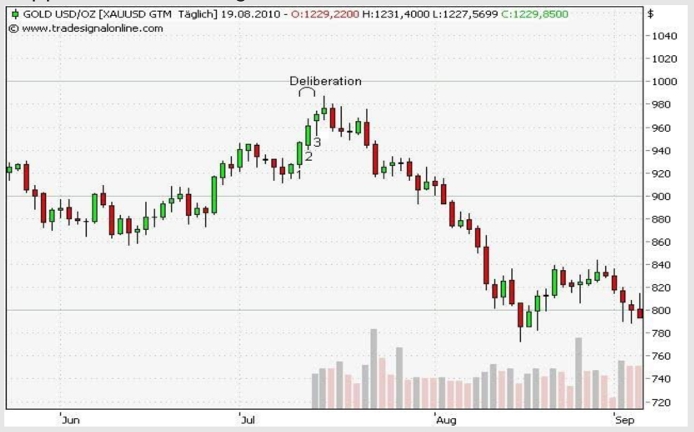
36. Deliberation Pattern
Signal: Bearish Pattern
The Deliberation Pattern is a bearish reversal signal that typically forms in an extended uptrend, suggesting that the bullish momentum is slowing down. It consists of three consecutive bullish candles, with the first two being long and strong, while the third candle is either small or a doji. This final candle reflects hesitation or exhaustion among buyers, implying that the market might be running out of upward steam. The Deliberation Pattern is a warning sign that the trend could reverse, making it important for traders to watch for confirmation, such as a bearish candle or a break below support, before taking action.
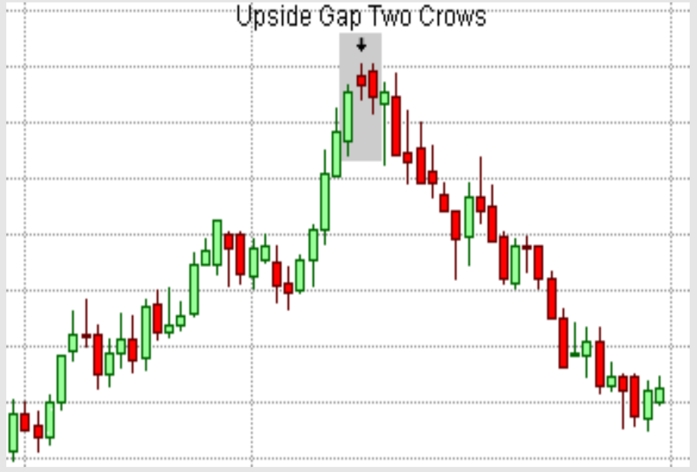
37. Upside Gap Two Crows Pattern
Signal: Bearish Pattern
The Upside Gap Two Crows is a rare bearish reversal pattern that forms during an uptrend. It begins with a bullish candle, followed by a second candle that gaps up but closes lower, creating a bearish signal. The third candle then opens within the body of the second and continues to push lower, closing below the second candles close. This pattern suggests that the initial bullish sentiment is weakening, and bears are gradually taking control. Traders view this formation as a signal of potential trend reversal, especially when it occurs after a prolonged rally or in overbought conditions.
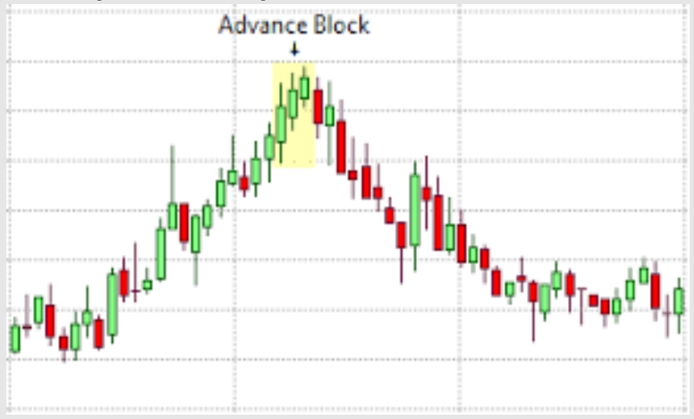
38. Advance Block Pattern
Signal: Bearish Pattern
The Advance Block is another bearish reversal pattern that appears during an uptrend, consisting of three consecutive bullish candles. While each candle makes a new high, they become progressively smaller, showing a decrease in upward momentum. The weakening strength of each subsequent candle indicates that buyers are losing control, and the market might be preparing for a reversal. The Advance Block pattern often serves as an early warning sign that the uptrend is running out of steam, especially when accompanied by other bearish signals, such as declining volume or negative technical indicators.
Continuation Candlestick Patterns
Continuation patterns indicate the likelihood of the current trend continuing in the same direction. These patterns suggest a brief consolidation before resuming the prevailing trend.
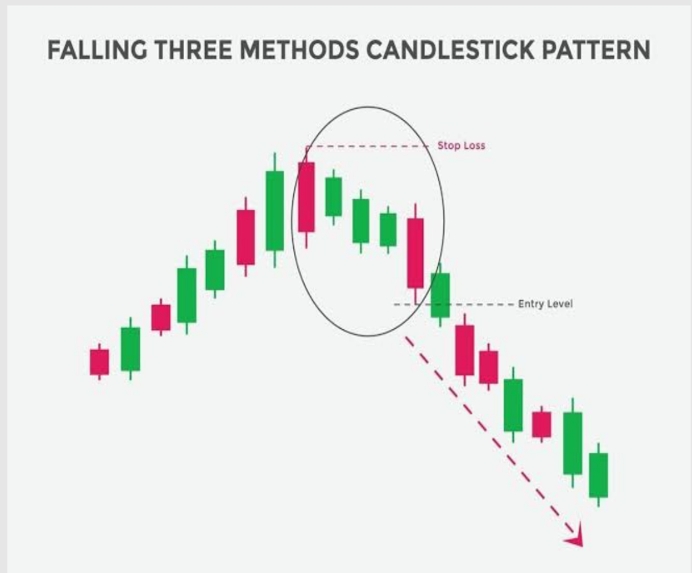
39. Falling Three Methods Pattern
Signal: Bearish Continuation Pattern
The falling three methods is a bearish continuation pattern. It consists of: a long, bearish candlestick followed by three smaller bullish candlesticks that stay within the range of the first candlestick and then another long, bearish candlestick. This pattern indicates a temporary pause in the downtrend before it continues.
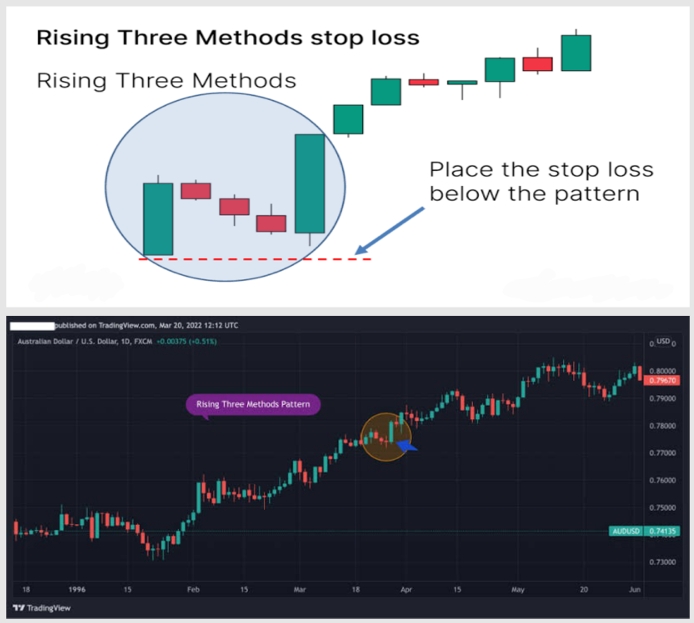
40. Rising Three Methods Pattern
Signal: Bullish Continuation Pattern
The rising three methods is a bullish continuation pattern. It consists of: a long bullish candlestick followed by three smaller bearish candlesticks that stay within the range of the first candlestick and then another long bullish candlestick. This pattern indicates a temporary pause in the uptrend before it continues.
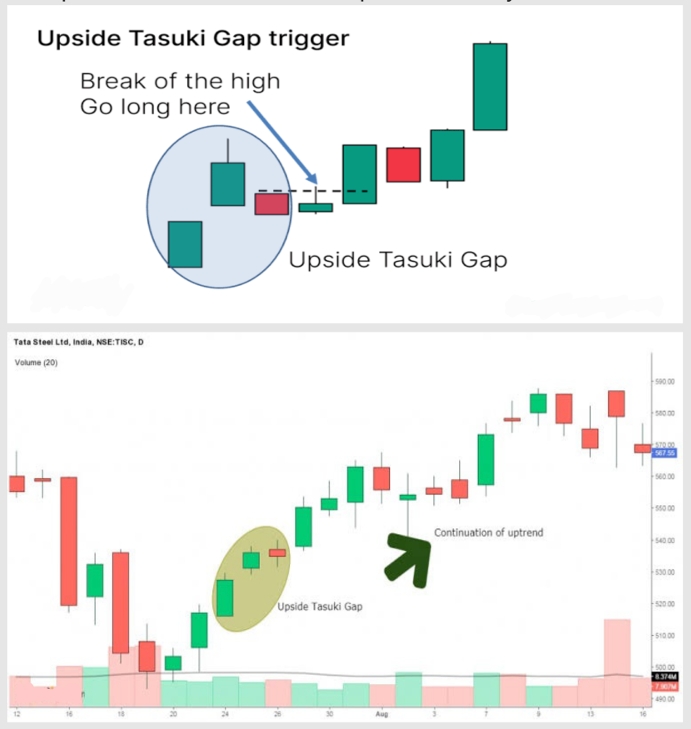
41. Upside Tasuki Gap Pattern
Signal: Bullish Continuation Pattern
The upside tasuki gap is a bullish continuation pattern. It occurs in an uptrend where a bullish candlestick gaps up from the previous one, followed by a bearish candlestick that partially fills the gap. This pattern indicates that the uptrend is likely to continue.
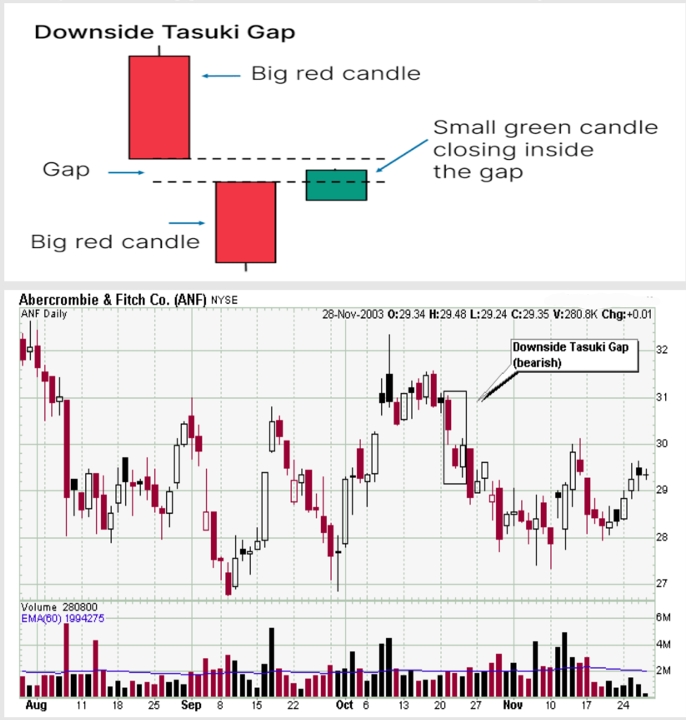
42. Downside Tasuki Gap Pattern
Signal: Bearish Continuation Pattern
The downside Tasuki gap is a bearish continuation pattern. It occurs in a downtrend where a bearish candlestick gaps down from the previous one, followed by a bullish candlestick that partially fills the gap. This pattern suggests that the downtrend is likely to continue.
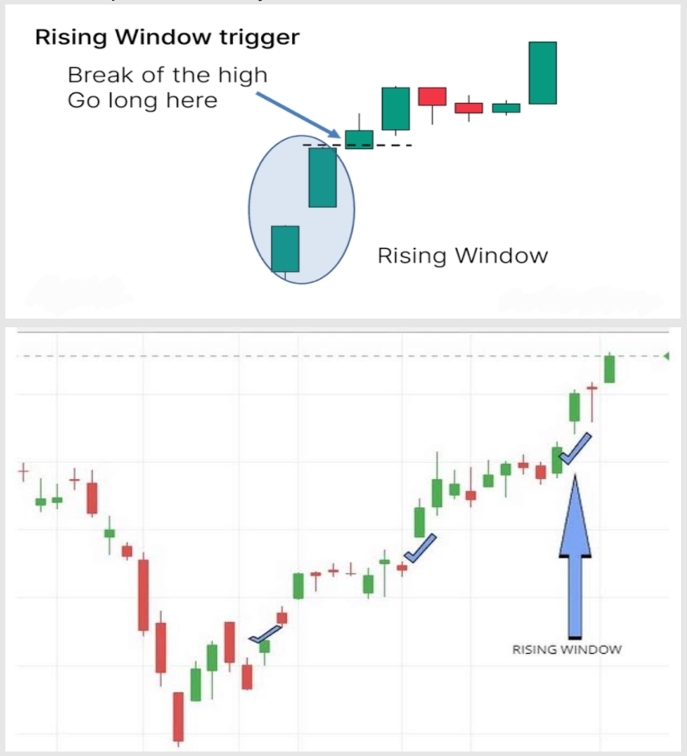
43. Rising Window Pattern
Signal: Bullish Continuation Pattern
A rising window is a bullish continuation pattern characterized by a gap between two bullish candlesticks. This pattern indicates strong buying pressure and suggests that the uptrend is likely to continue.
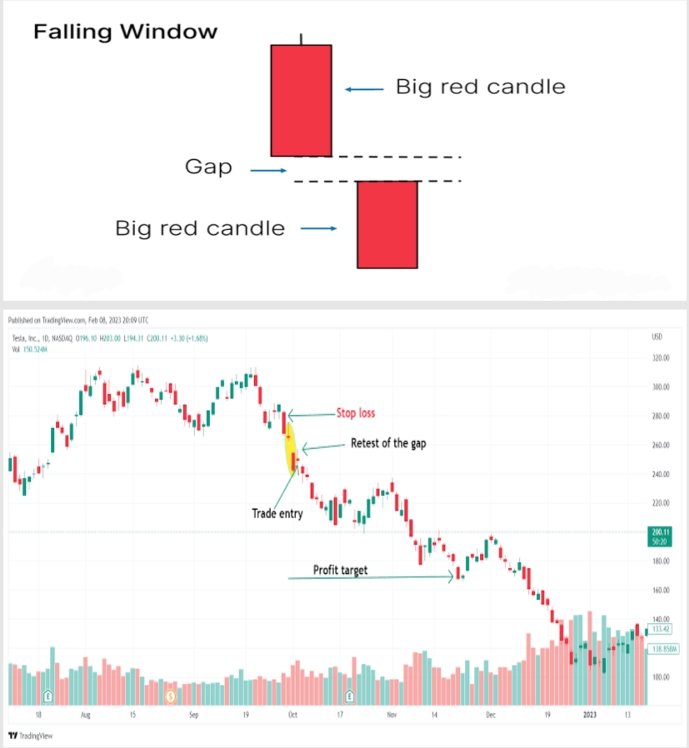
44. Falling Window Pattern
Signal: Bearish Continuation Pattern
A falling window is a bearish continuation pattern characterized by a gap between two bearish candlesticks. This pattern indicates strong selling pressure and suggests that the downtrend is likely to continue.
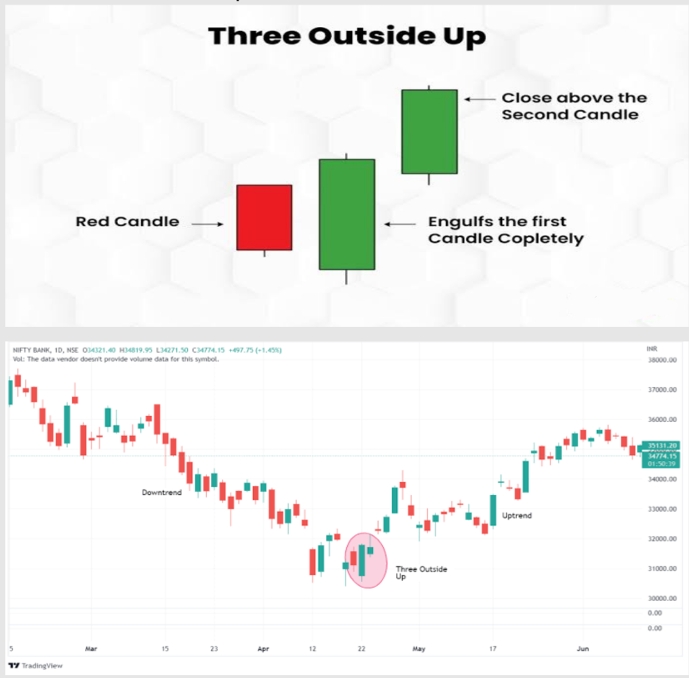
45. Three Outside Up Pattern
Signal: Bullish Continuation Pattern
The three-outside-up pattern consists of a bearish candlestick, followed by a larger bullish candlestick that engulfs the previous one and another bullish candlestick that closes higher. This pattern confirms a bullish reversal and suggests a continuation of the uptrend.
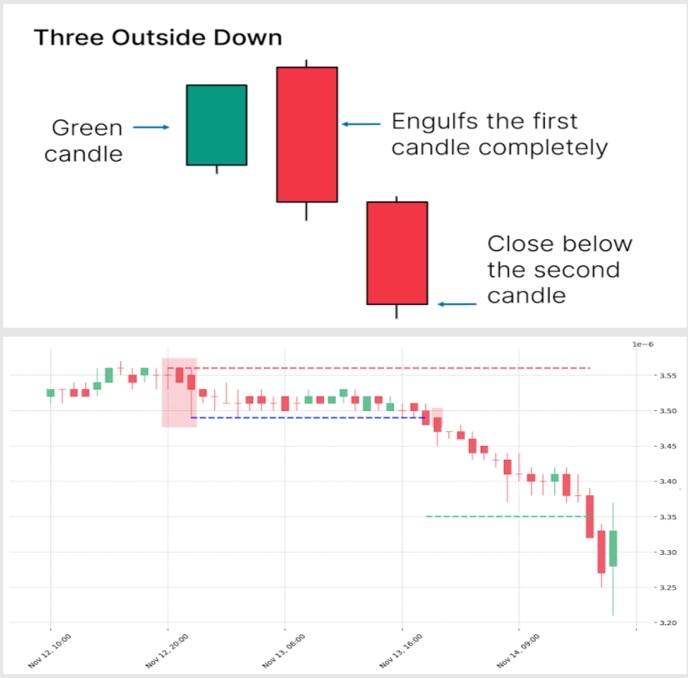
46. Three Outside Down Pattern
Signal: Bearish Continuation Pattern
The three-outside down pattern consists of a bullish candlestick, followed by a larger bearish candlestick that engulfs the previous one and another bearish candlestick that closes lower. This pattern confirms a bearish reversal and suggests a continuation of the downtrend.
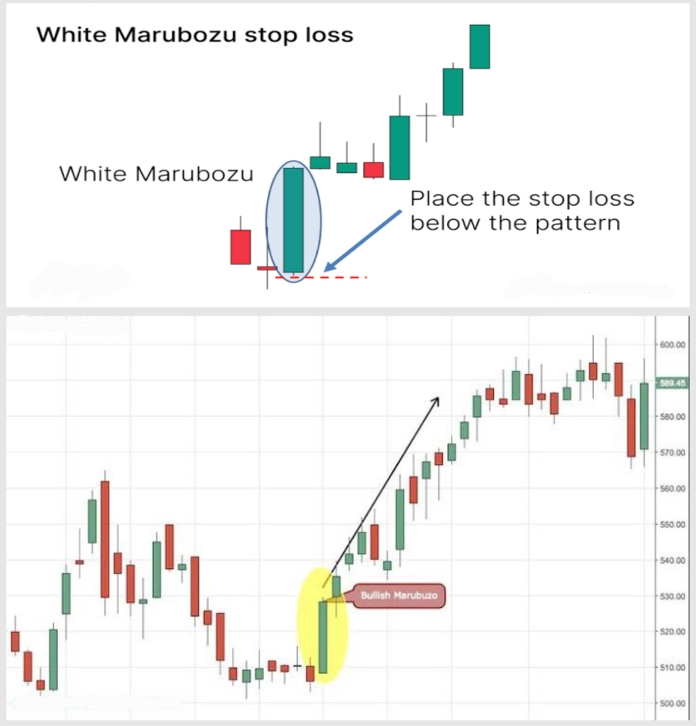
47. White Marubozu Pattern
Signal: Bullish Continuation Pattern
A white marubozu is a bullish candlestick with no wicks, which opens at its low and closes at its high. This technical analysis pattern shows strong buying pressure throughout the trading session and suggests a continuation of the uptrend.
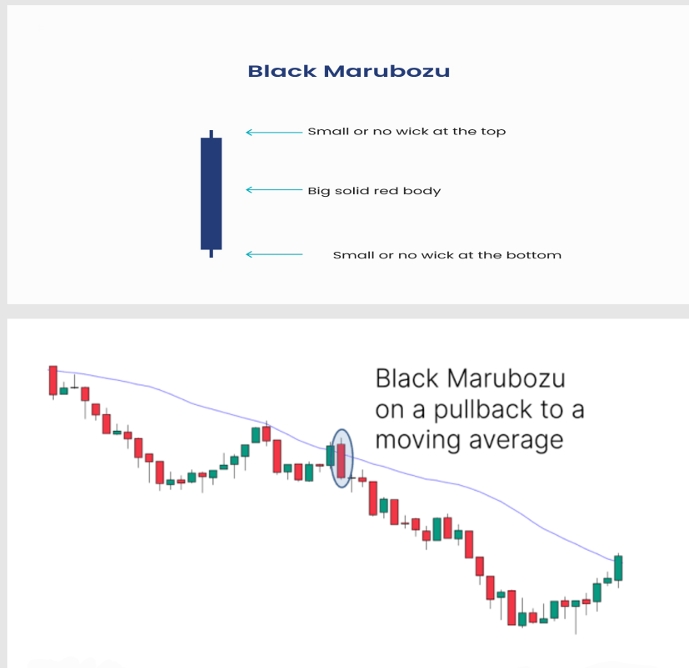
48. Black Marubozu Pattern
Signal: Bearish Continuation Pattern
A black marubozu is a bearish candlestick with no wicks, which opens at its high and closes at its low. This pattern shows strong selling pressure throughout the trading session and suggests a continuation of the downtrend.
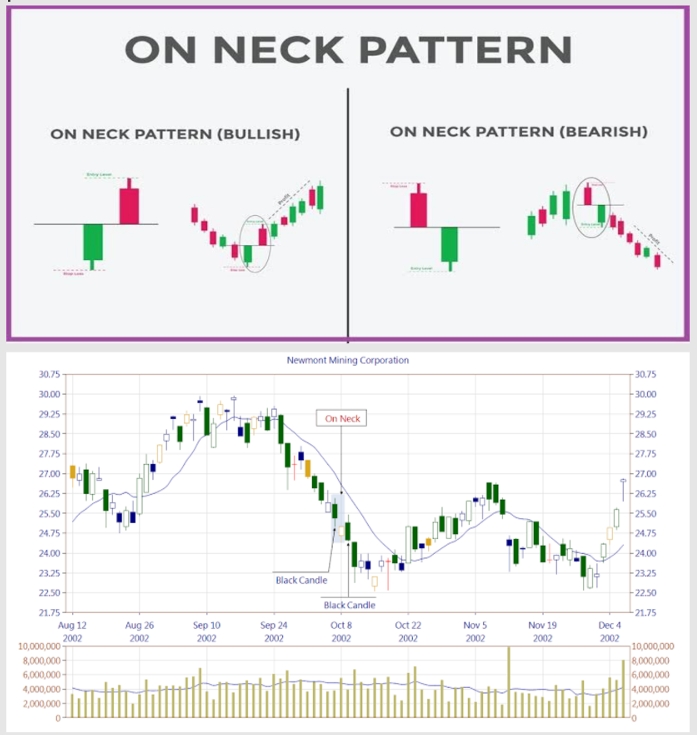
49. On-Neck Pattern Pattern
Signal: Continuation Pattern
The on-neck pattern is a bullish continuation pattern formed by a bearish candlestick followed by a smaller bullish candlestick that closes at or near the low of the previous candlestick. This pattern suggests that the selling pressure is weakening, and the uptrend is likely to continue.
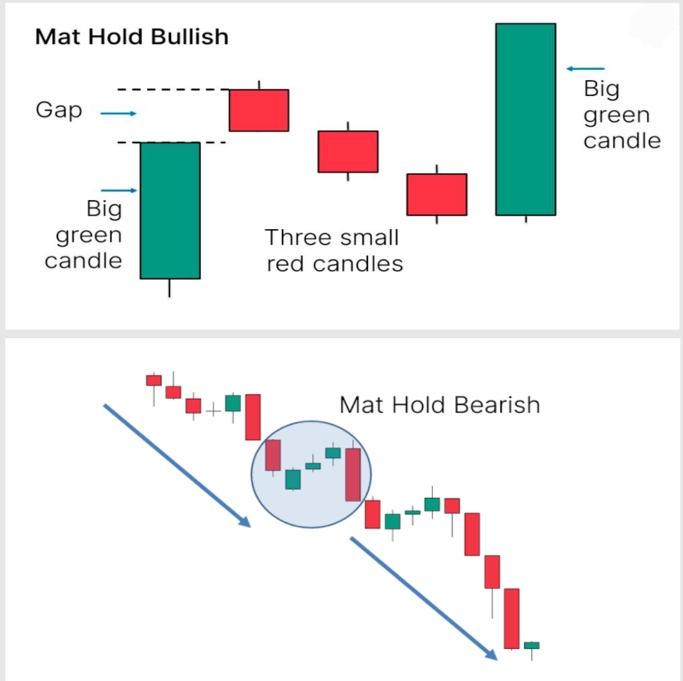
50. Mat-Hold Pattern
Signal: Continuation Pattern
The mat-hold is a bullish continuation pattern. It starts with a long bullish candlestick, followed by three smaller bearish candlesticks that stay within the range of the first candlestick, and then another long bullish candlestick that closes above the first ones high. This pattern indicates a strong continuation of the uptrend.
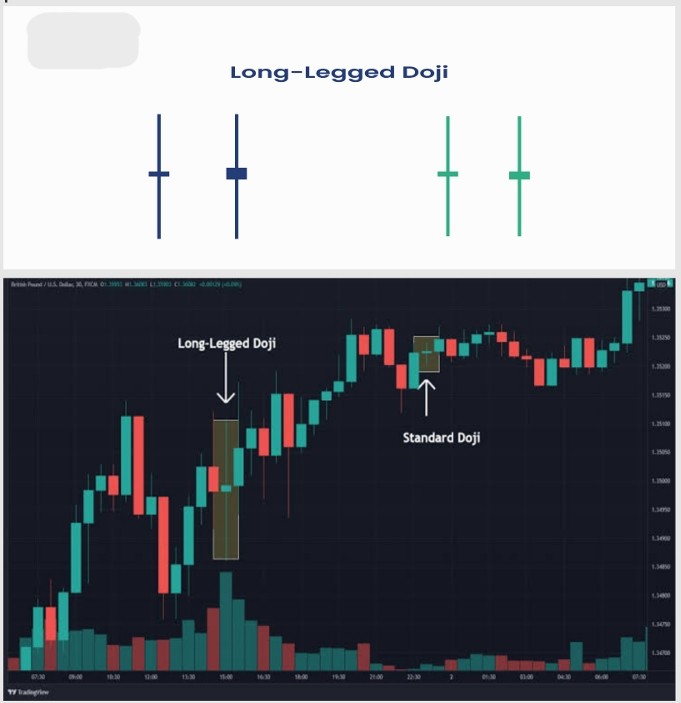
51. Long Legged Doji Pattern
Signal: Continuation Pattern
A long-legged doji is a neutral pattern with a small body and long wicks on both sides. It indicates high volatility and indecision in the market. Depending on its position and context, it can signal a potential reversal or continuation of the current trend.
Limitations of Candlestick Patterns
While candlestick patterns are very useful for identifying market trends, they have limitations that can impact their reliability.
Success Rate Insights
- • Popular patterns like bullish engulfing or hammer have success rates between 60-70% when combined with other indicators
- • Effectiveness improves when used with volume analysis, trend confirmation, or support/resistance levels
- • Always use multiple confirmation signals rather than relying on patterns alone