
Forex Market Learning Index
Complete guide to master forex market trading
Foundation Concepts
Advanced Trading
All About Analysis In Forex Market
Master the art of trading through comprehensive analysis techniques in the Forex market
Analysis Methods for Trading/Investing
Technical Analysis
Chart patterns and indicators
Fundamental Analysis
Macroeconomic factors and policies
Quantitative Analysis
Numbers and statistical data
Price Action
Pure price movement analysis
Understanding Each Analysis Method
Technical Analysis
Uses similar tools as stock market analysis but adapts to shorter timeframes and high volatility in forex markets. Reading market on the basis of tools/charts and indicators.
Fundamental Analysis
Focuses on macroeconomic factors, central bank policies, and geopolitical events that influence currency values.
Quantitative Analysis
Trading on the basis of numbers, statistics like graphs, pie charts. Analyzing data to make informed trading decisions.
Price Action
Analyzing the price or price movement of currency pairs (Best For Trading). More precise than any other analysis method.
Fundamental vs Technical Analysis in Forex
Fundamental Analysis
Focuses on macroeconomic factors, central bank policies, and geopolitical events. This includes analyzing economic indicators, interest rates, GDP growth, inflation, and employment data to determine currency strength.
Technical Analysis
Uses similar tools as stock market analysis but adapts to shorter timeframes and high volatility. This involves analyzing technical charts and tools to identify patterns and create indicators for forex trading.
Key Insight
Many forex traders use a combination of both fundamental and technical analysis to make trading decisions. Fundamental analysis can help identify targets, while technical analysis can help determine precise entry and exit points.
Pro Tip: By combining fundamental and technical analysis, forex traders can gain a complete understanding of the market, balancing macroeconomic trends with precise entry and exit points.
Technical Analysis
All about technical analysis and how to do accurate technical analysis in Forex
We do technical analysis while trading. In this we highly rely on category/group of indicators and reading market on the basis of tools/charts in technical analysis.
Tools for Technical Analysis
- Drawing Tools
- Candlestick Patterns
- Chart Patterns
- Indicators
Purpose of Tools
- Understand the market condition
- Area of Value
- Entry Trigger
We combine these tools & make high probability trading setups.
Drawing Tools
- → Trendline
- → Trend Channel
- → Support & Resistance (see support and resistance section for more details)
- → Use to find area of value to trade from (buy low and sell high)
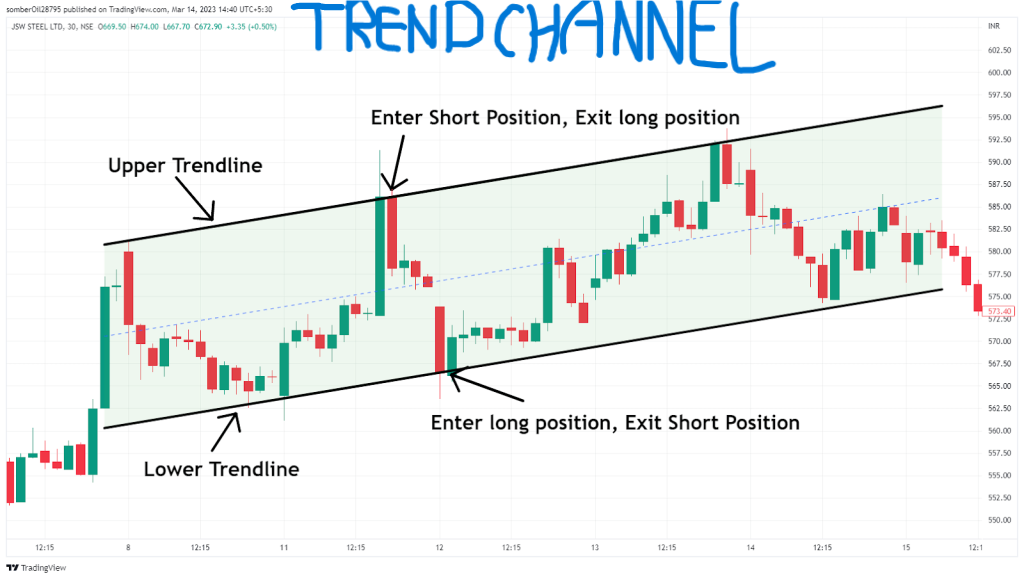
Chart Patterns
- • Quick assessment of strength, weakness, or equilibrium in the market
- • Useful as an entry trigger & understanding market condition
Indicators
- • A tool that takes historical data & applies a formula to it
- • "Summarize" the market price action and useful as an entry trigger
Common Trading Indicators
Volatility Cycle
Best to enter at low volatility period so you know volatility will increase from there. A high volatility period you don't know till when it will be up.
Average True Range (ATR)
It measures the volatility. It can be used for Stop Loss.
Donchian Channel
Shows 20-day upper band + 20-day lower band + Average. Can be used to identify potential buying set-up when price touches the outer band. If price crosses the 200 period middle band then look only for shorting opportunities.
Moving Average
Mainly used for determining trend direction. SMA and EMA for identifying trends. Crossovers (Golden Cross, Death Cross) for signals.
Fibonacci Levels
Fibonacci retracement and extension levels are widely used in forex TA to identify potential support and resistance zones.
Key Levels: 23.6%, 38.2%, 50%, 61.8%, and 78.6%
How to Use:
- Draw retracement levels between swing high and swing low to predict where price might pull back
- Use extension levels to predict future price targets during trends
Volume Analysis
Volume shows the number of transactions within a given time, providing insights into the strength of a trend.
- High Volume: Confirms strong trends or breakout movements
- Low Volume: Indicates weak trends or potential reversal zones
- Volume Spikes: Signal unusual activity, often preceding major price moves
Multiple Timeframe Analysis
Analyze different timeframes to get a holistic view of the market.
- Short-Term: For day traders
- Medium-Term: For swing traders
- Long-Term: For position traders
Breakouts and Fakeouts
Forex markets frequently see breakouts and fakeouts.
Breakouts:
- Look for confirmation with volume spikes
- Use breakout strategies for entry, such as buying above resistance or selling below support
Fakeouts:
- Common in forex due to high speculation
- Use stop-loss orders to manage risk and confirm breakouts with multiple indicators
Risk Management in Technical Analysis
Effective technical analysis includes risk management to protect capital.
- Stop-Loss Orders: Set automatic sell orders to limit losses
- Position Sizing: Allocate a small portion of capital to any single trade
- Risk-Reward Ratio: Aim for trades with a reward at least 2-3 times the potential risk
- Trailing Stops: Lock in profits by adjusting stop-loss orders as price moves favorably
Indicators and Oscillators
Trend Indicators:
- Moving Averages (MA): SMA and EMA for identifying trends
- Crossovers (Golden Cross, Death Cross) for signals
- Ichimoku Cloud: Combines trend, support/resistance, and momentum
Momentum Indicators:
- Relative Strength Index (RSI): Measures overbought (more than 70) or oversold (less than 30) conditions
- Stochastic Oscillator: Focuses on closing price relative to price range
- MACD: Measures momentum and trend direction
Volatility Indicators:
- Bollinger Bands: Identifies overbought/oversold zones based on standard deviation
- ATR (Average True Range): Measures volatility
Moving Average Crossovers
Moving averages are essential tools to identify potential reversals or continuations.
- Golden Cross: When the short-term MA (e.g., 50-day) crosses above the long-term MA (e.g., 200-day). A bullish signal.
- Death Cross: When the short-term MA crosses below the long-term MA. A bearish signal.
Professional Trading Examples
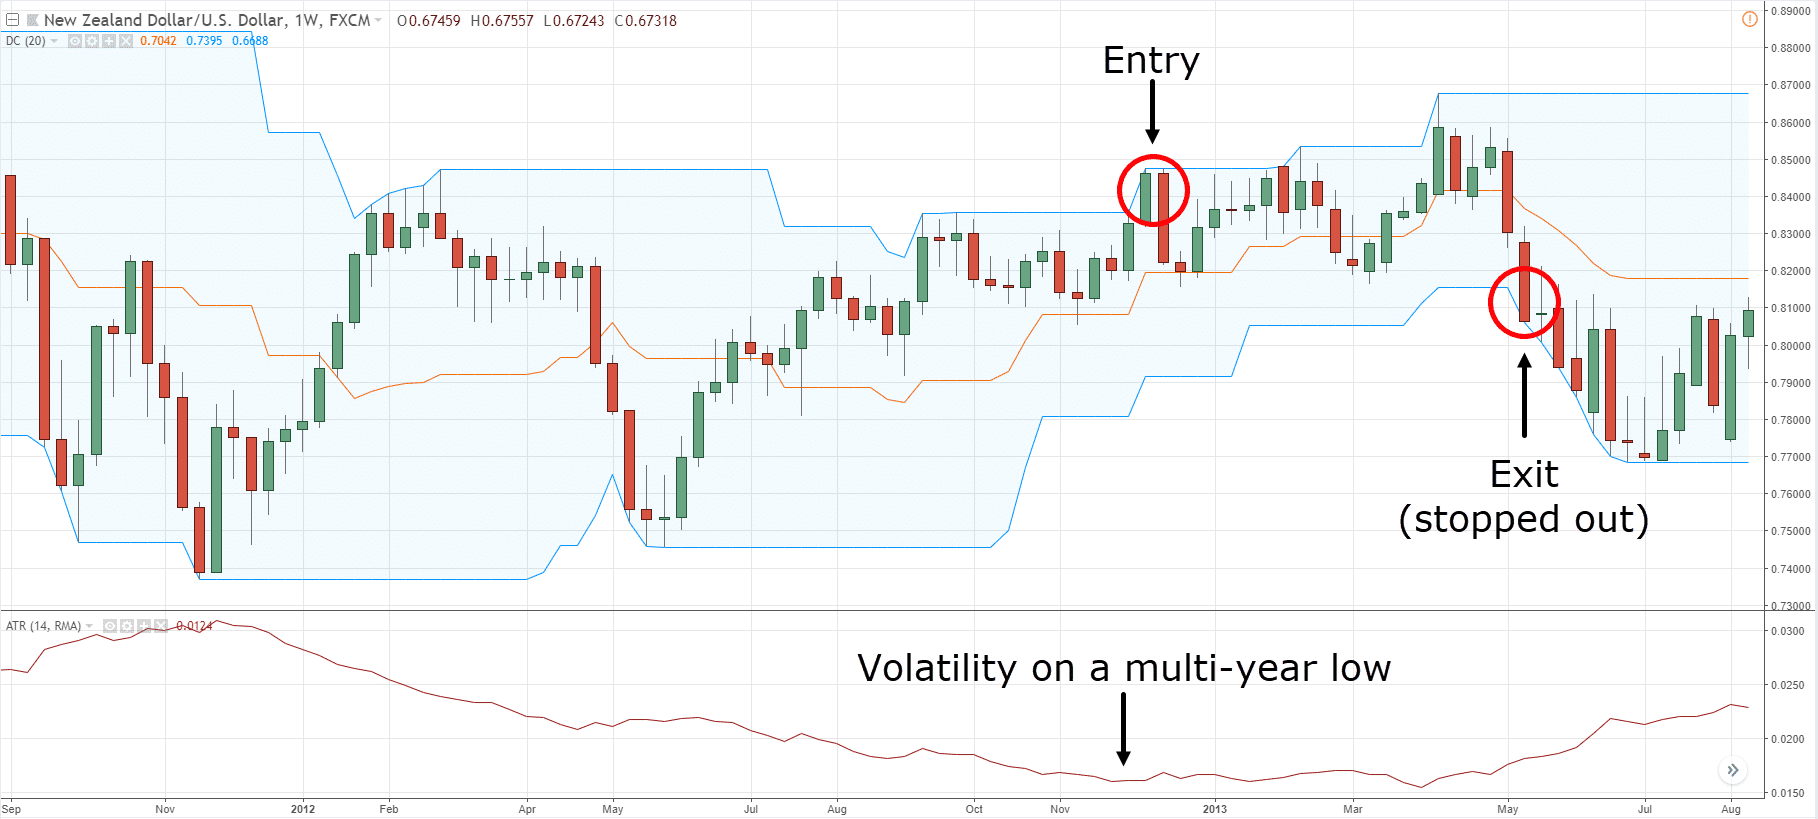
Donchian Channel + ATR
Set both indicators. If candlestick touches 20-day upper band in Donchian Channel and in ATR volatility is low, make entry there & exit when it touches 20-day lower band.
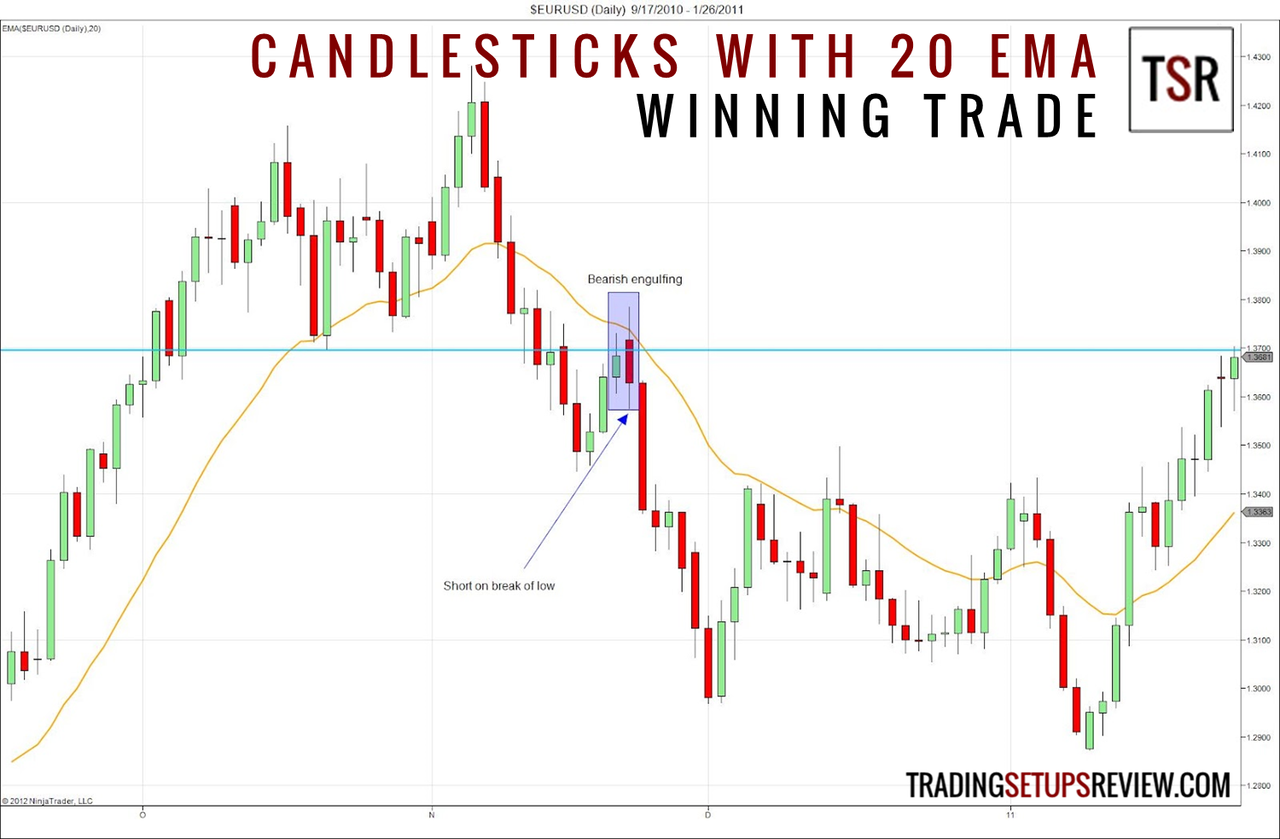
Moving Avg + Candlestick
Helps define area of value and patterns can help decide trend.
Resistance + Candlestick
If Tweezer Top patterns form at resistance level, it has potential for downtrend to start.
By combining these tools and techniques, technical analysis in the forex market allows traders to identify potential opportunities, understand market sentiment, and execute trades with greater confidence.
Fundamental Analysis
All about fundamental analysis and how to do accurate fundamental analysis in Forex
Fundamental Analysis in the Forex Market
Fundamental analysis in forex focuses on understanding the macroeconomic factors that influence the value of a currency relative to another. This includes economic indicators, central bank policies, geopolitical events, and more.
Economic Indicators
Economic indicators reveal the health of an economy and significantly impact currency valuations.
GDP Growth (Gross Domestic Product)
- Measures the overall economic performance of a country
- Higher-than-expected GDP growth often strengthens a currency
- Example: Strong U.S. GDP can bolster USD strength against weaker economies
Inflation Rates (CPI & PPI)
- CPI (Consumer Price Index): Tracks changes in consumer prices for goods and services
- PPI (Producer Price Index): Measures price changes at the producer level
- Central banks monitor inflation closely to adjust monetary policy
- High inflation may lead to interest rate hikes, strengthening the currency
Employment Data (Non-Farm Payrolls, Unemployment Rate)
- A low unemployment rate or strong job creation often strengthens the domestic currency
- Example: U.S. Non-Farm Payrolls (NFP) data is a high-impact indicator for the USD
Retail Sales and Consumer Confidence
- Reflect consumer spending, a major component of GDP
- Rising retail sales indicate a growing economy, which is positive for the currency
Central Bank Policies
Central banks are key players in the forex market, directly influencing currency values through their monetary policies.
Interest Rates
- Higher interest rates attract foreign capital, strengthening the currency
- Central banks like the Federal Reserve, ECB, and BOE adjust rates to manage inflation and growth
- Example: A Fed rate hike often strengthens the USD
Quantitative Easing (QE) or Tightening
- QE increases money supply (weakens currency)
- Tightening reduces money supply (strengthens currency)
Forward Guidance
- Statements from central banks about future policies influence market sentiment
- Example: The European Central Bank (ECB) signaling future rate hikes can strengthen the Euro
Balance of Trade
The balance of exports and imports (trade surplus or deficit) influences currency strength.
- Trade Surplus: Strengthens the currency as foreign buyers demand more of the country's currency for goods
- Trade Deficit: Weakens the currency due to higher demand for foreign currencies
- Example: China's trade surplus often strengthens the Yuan (CNY)
Geopolitical Events
Geopolitical tensions, elections, and natural disasters create uncertainty and volatility in forex markets.
- Safe-Haven Currencies: During geopolitical crises, investors often move to safe-haven currencies like USD, JPY, and CHF
- Political Stability: A stable political environment attracts foreign investment, strengthening the currency
Commodity Prices
Certain currencies are tied closely to commodity exports (commodity currencies).
Examples:
- AUD correlates with gold and iron ore prices
- CAD correlates with oil prices due to Canada's heavy oil exports
Global Risk Sentiment
- Risk-On Environment: Investors favor riskier assets, leading to demand for higher-yield currencies like AUD or NZD
- Risk-Off Environment: Investors seek safe-haven currencies like USD, JPY, and CHF during uncertainty or market crashes
Market Correlations
Currencies often correlate with global indices, commodities, and other assets.
- Gold and USD: Inverse correlation; gold prices often rise when USD weakens
- Oil and CAD: Positive correlation; rising oil prices often strengthen CAD due to Canada's oil exports
Relative Strength of Economies
- Forex involves currency pairs (e.g., EUR/USD)
- Fundamental analysis compares the relative strength of the two economies to predict which currency will outperform
Capital Flows
- Foreign Direct Investment (FDI): Inflows strengthen the domestic currency
- Portfolio Investments: Foreign investment in bonds or equities increases demand for the domestic currency
Price Action Analysis
The best way to analyze forex through pure price movement
→ Analyzing the price or price movement of currency pairs OR study of price is known as price action analysis.
→ Price Action is more precise than any other analysis
Technical Analysis vs Price Action
In technical analysis we rely on indicators, but indicators are lagging in nature that means they tell you the things that happened, and they create noise in chart means after putting indicators that chart becomes full and doesn't look good for analysis.
As you can see the chart looks so messy that it is very difficult to do analysis on this if we only rely on indicators and use too many indicators.
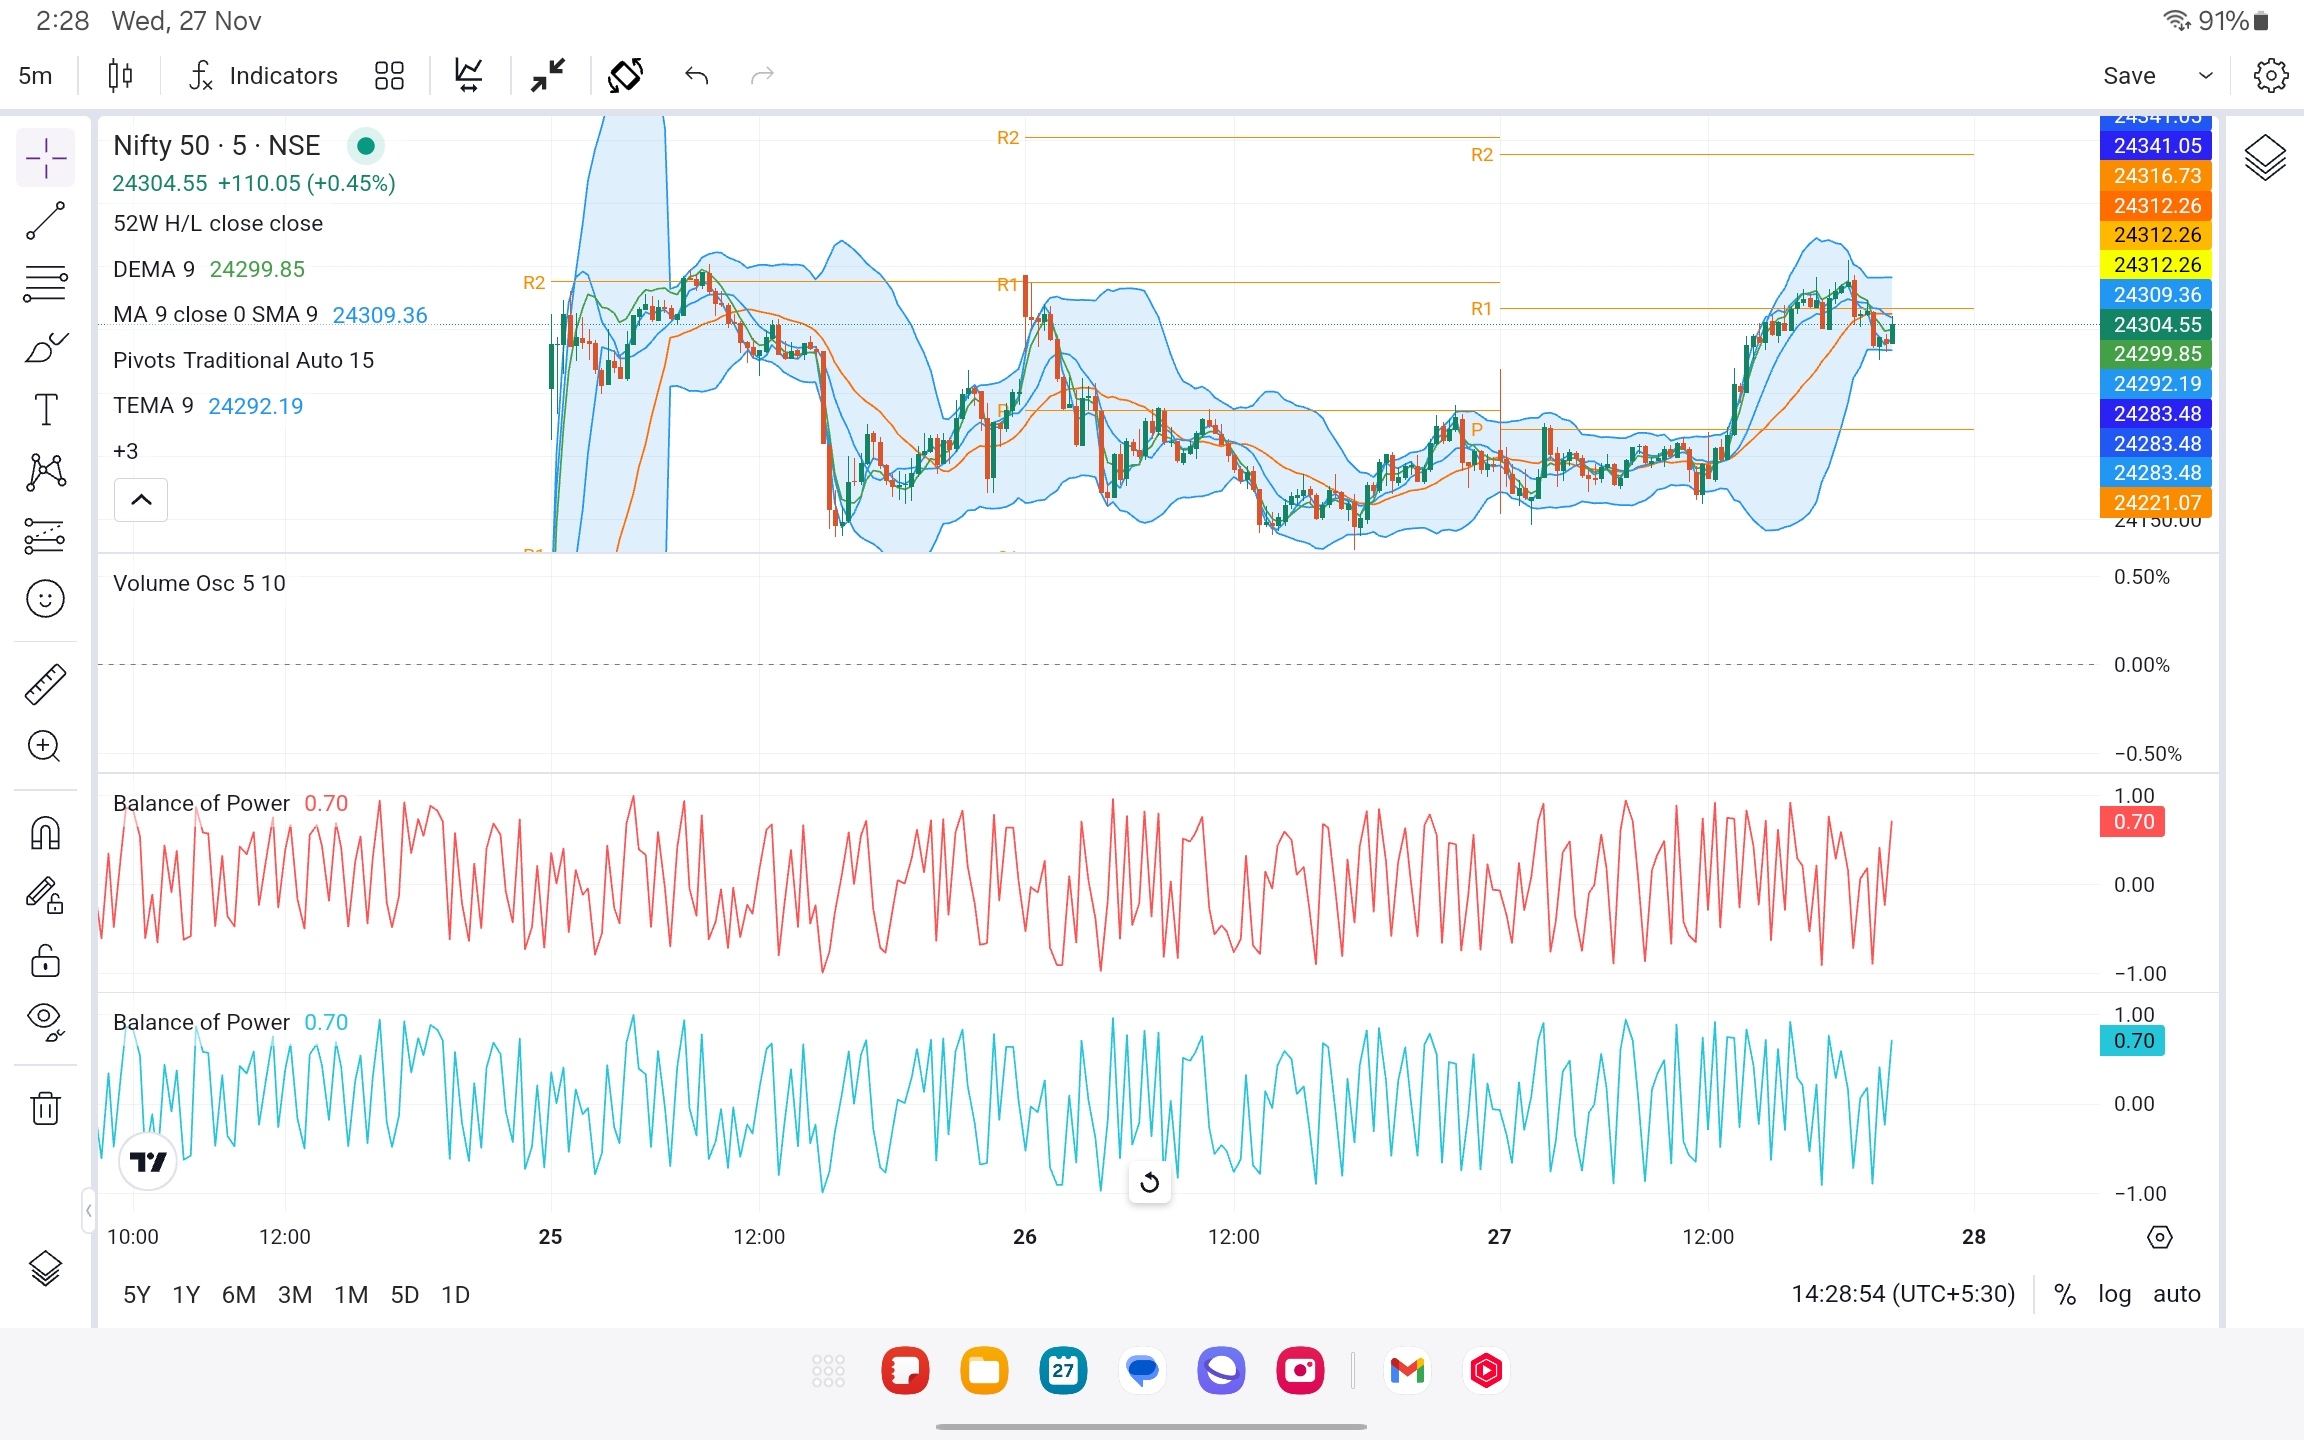
Example - Noisy/messy Chart
Price Action Strategies
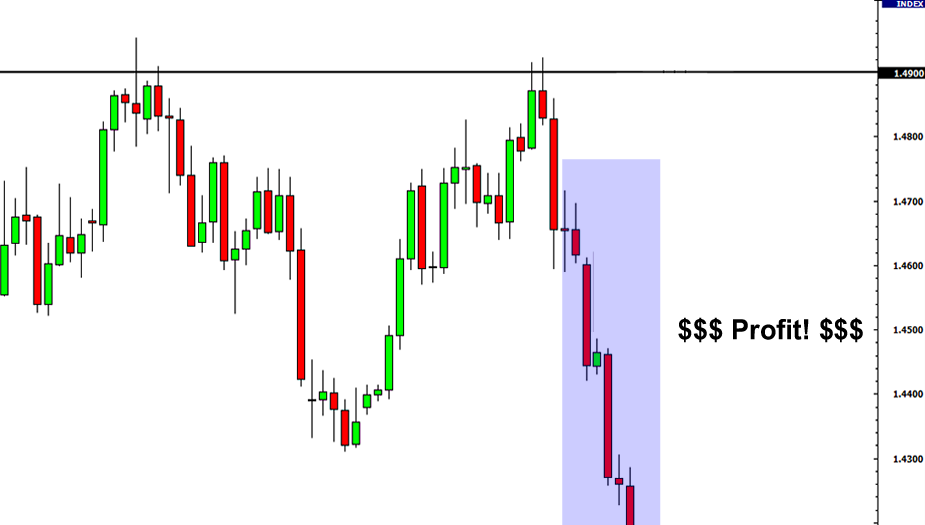
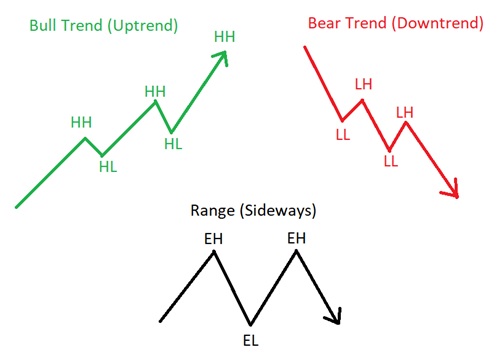
Trend Trading
Taking trades with the trend like if the market is going up or given breakout and charts and candlestick patterns are also indicating that the price may go more bullish so take upper calls and vice versa with bearish market.
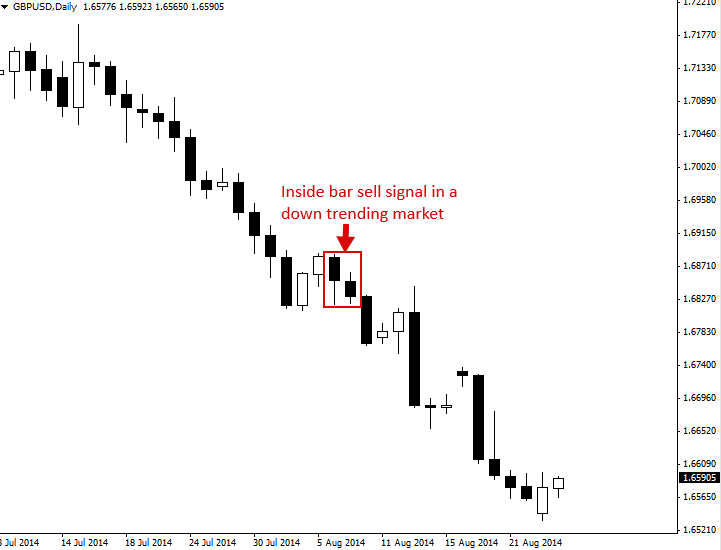
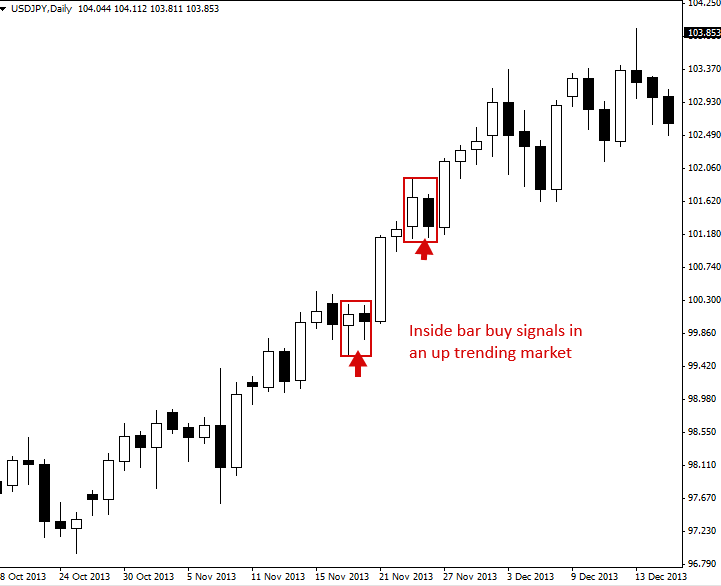
Inside Bar Strategy
Inside bars can be traded in trending markets in the direction of the trend, when traded this way they are typically referred to as a 'breakout play'. The classic entry is to place a buy stop or sell stop at the high or low of the mother bar.
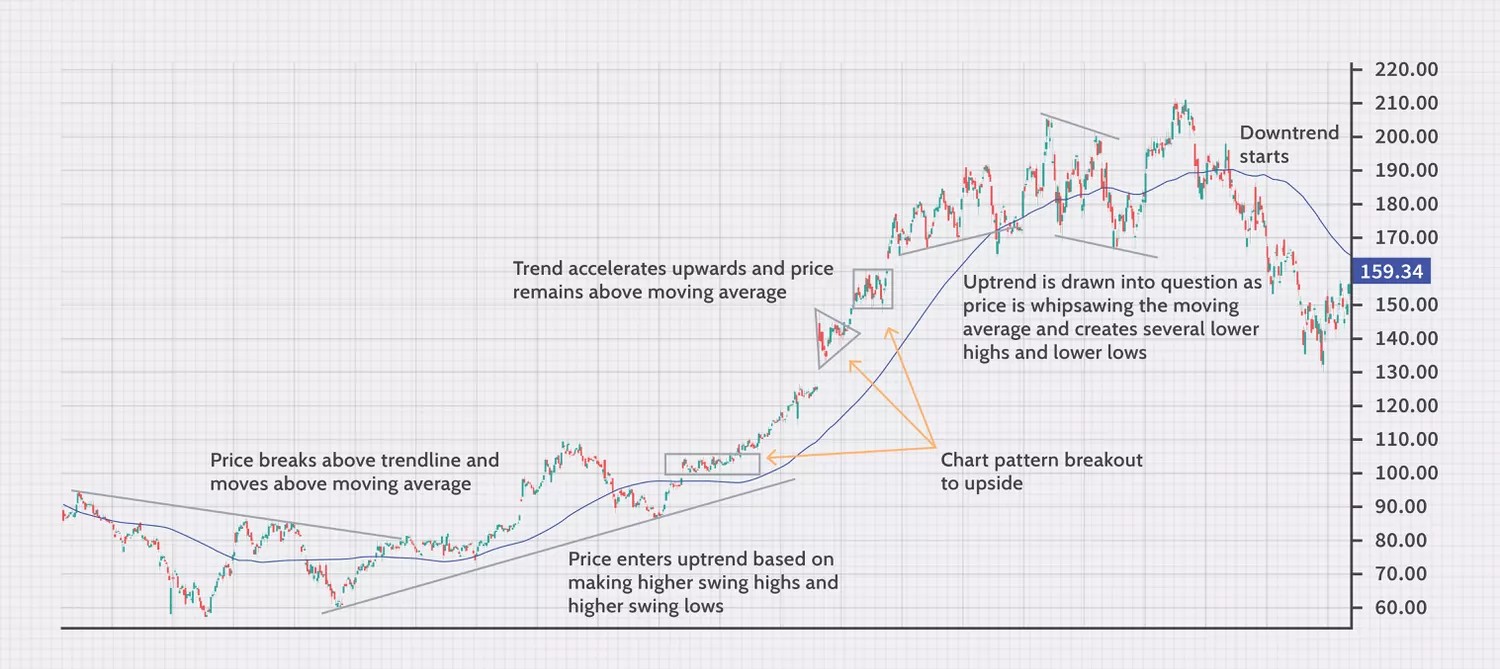
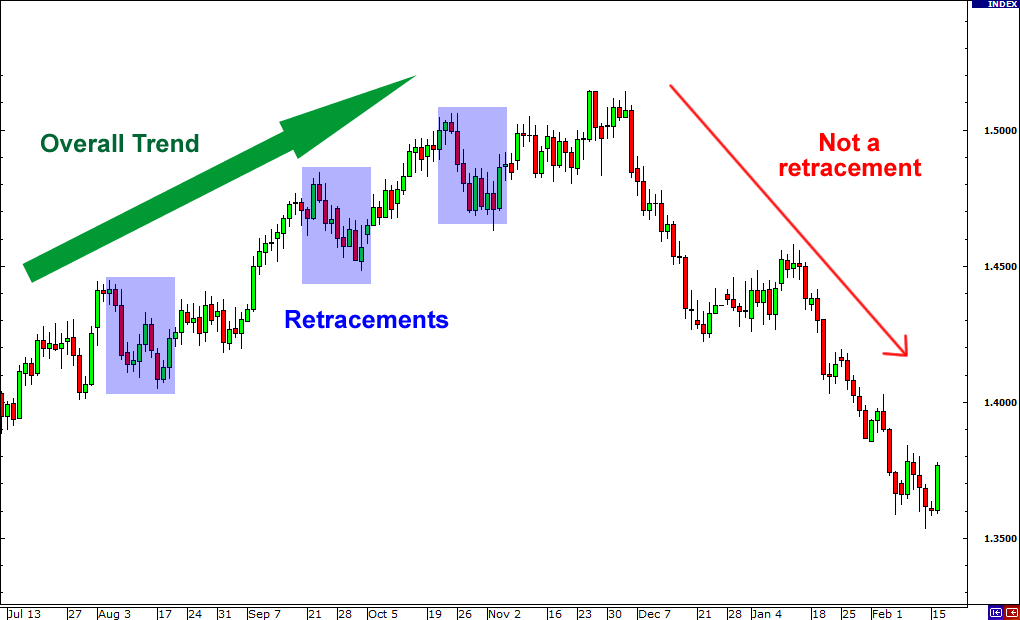
Retracements
Short term pullback or little correction is called retracement. A retracement is a technical term used to identify a minor pullback or change in the direction of a financial instrument. Retracements are temporary in nature and do not indicate a shift in the larger trend.
Reversal
A reversal is when the direction of a price trend has changed, from going up to going down, or vice-versa. Traders try to get out of positions that are aligned with the trend prior to a reversal. When it starts to occur, a reversal is not distinguishable from a pullback initially.

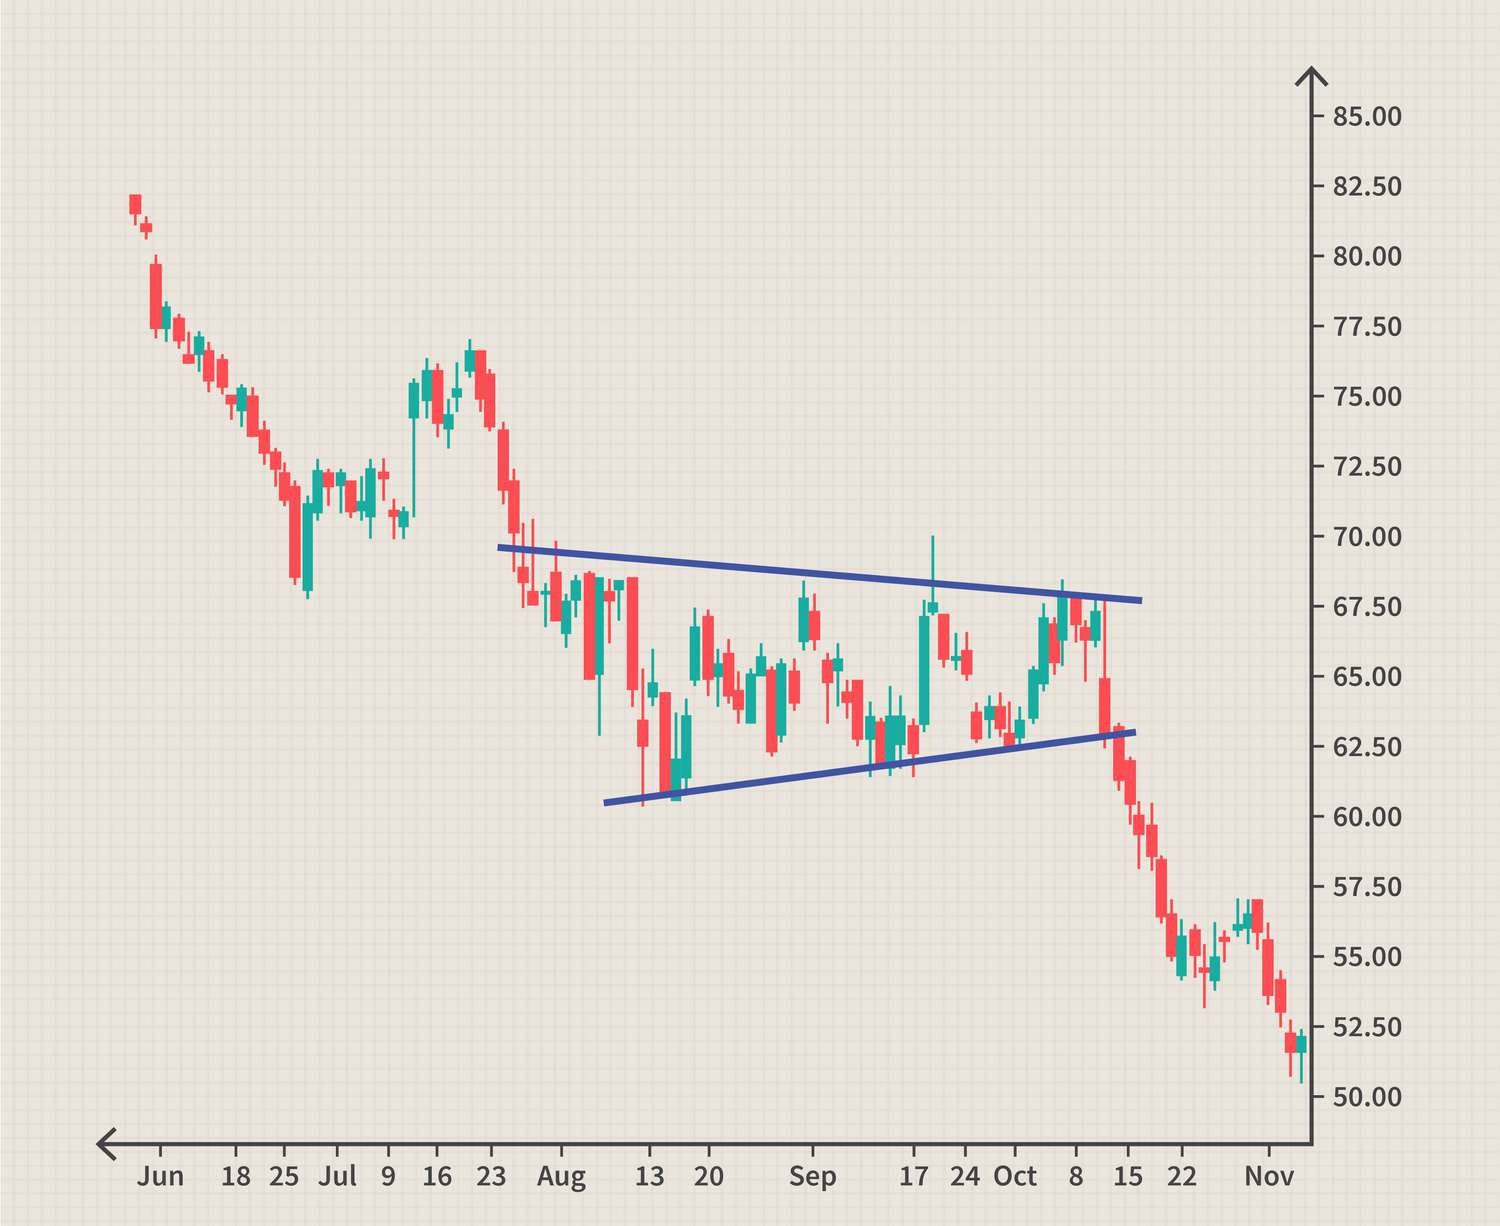
Breakouts & Breakdowns
Breakout → When the price of a security moves above a resistance level, signaling the start of an upward trend. Breakdown → When the price falls below a support level, signaling the start of a downward trend.

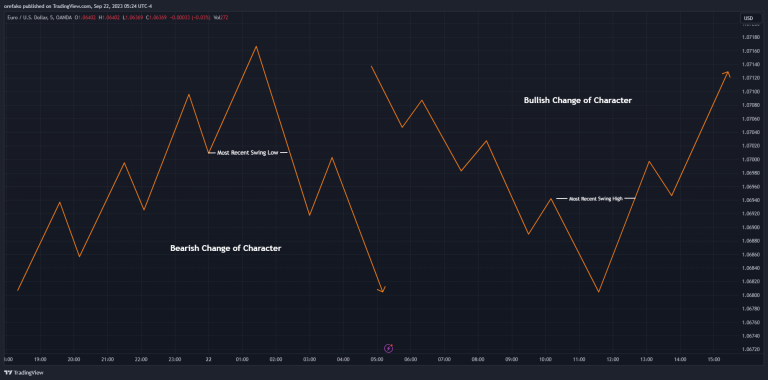
Change of Character
A Change of Character (ChoCh) in trading is a significant shift in the market's behavior or trend. It can indicate that a trend is losing momentum and a new trend is forming. It can be signaled by: a break in a previous trend line, an unusual volume spike, and a sudden increase in volatility.
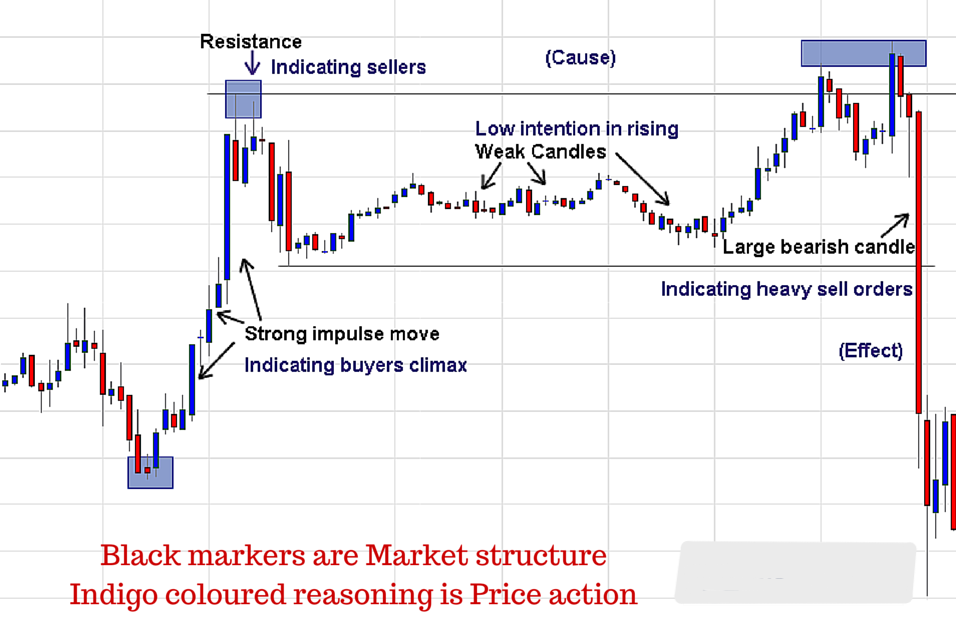
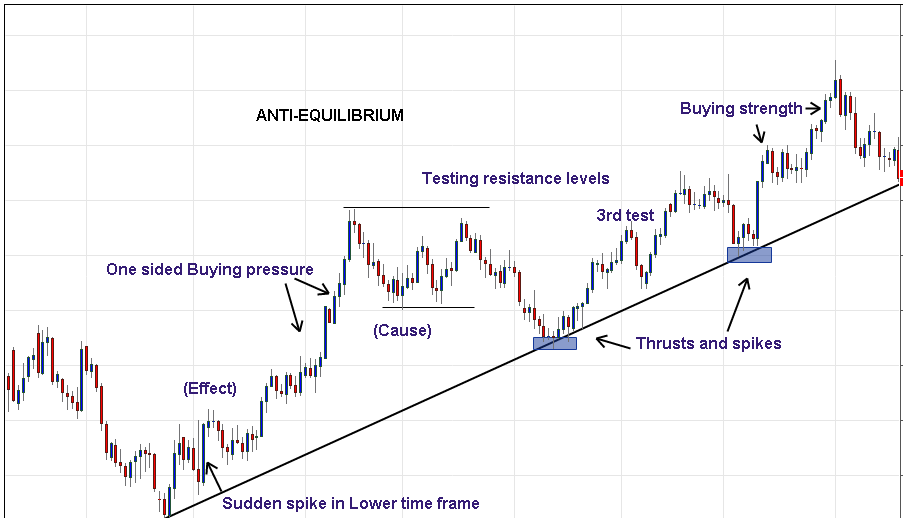
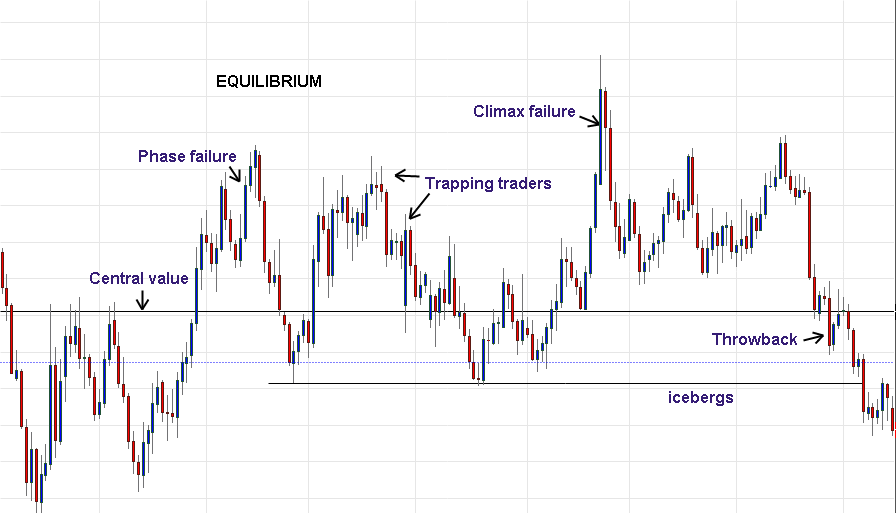
Market Structure
Traders can employ a range of techniques to effectively utilize market structure. One key aspect is identifying key support and resistance levels. Support levels are areas where buying pressure has been strong enough to prevent further price declines. Resistance levels are areas where selling pressure has halted price advances.
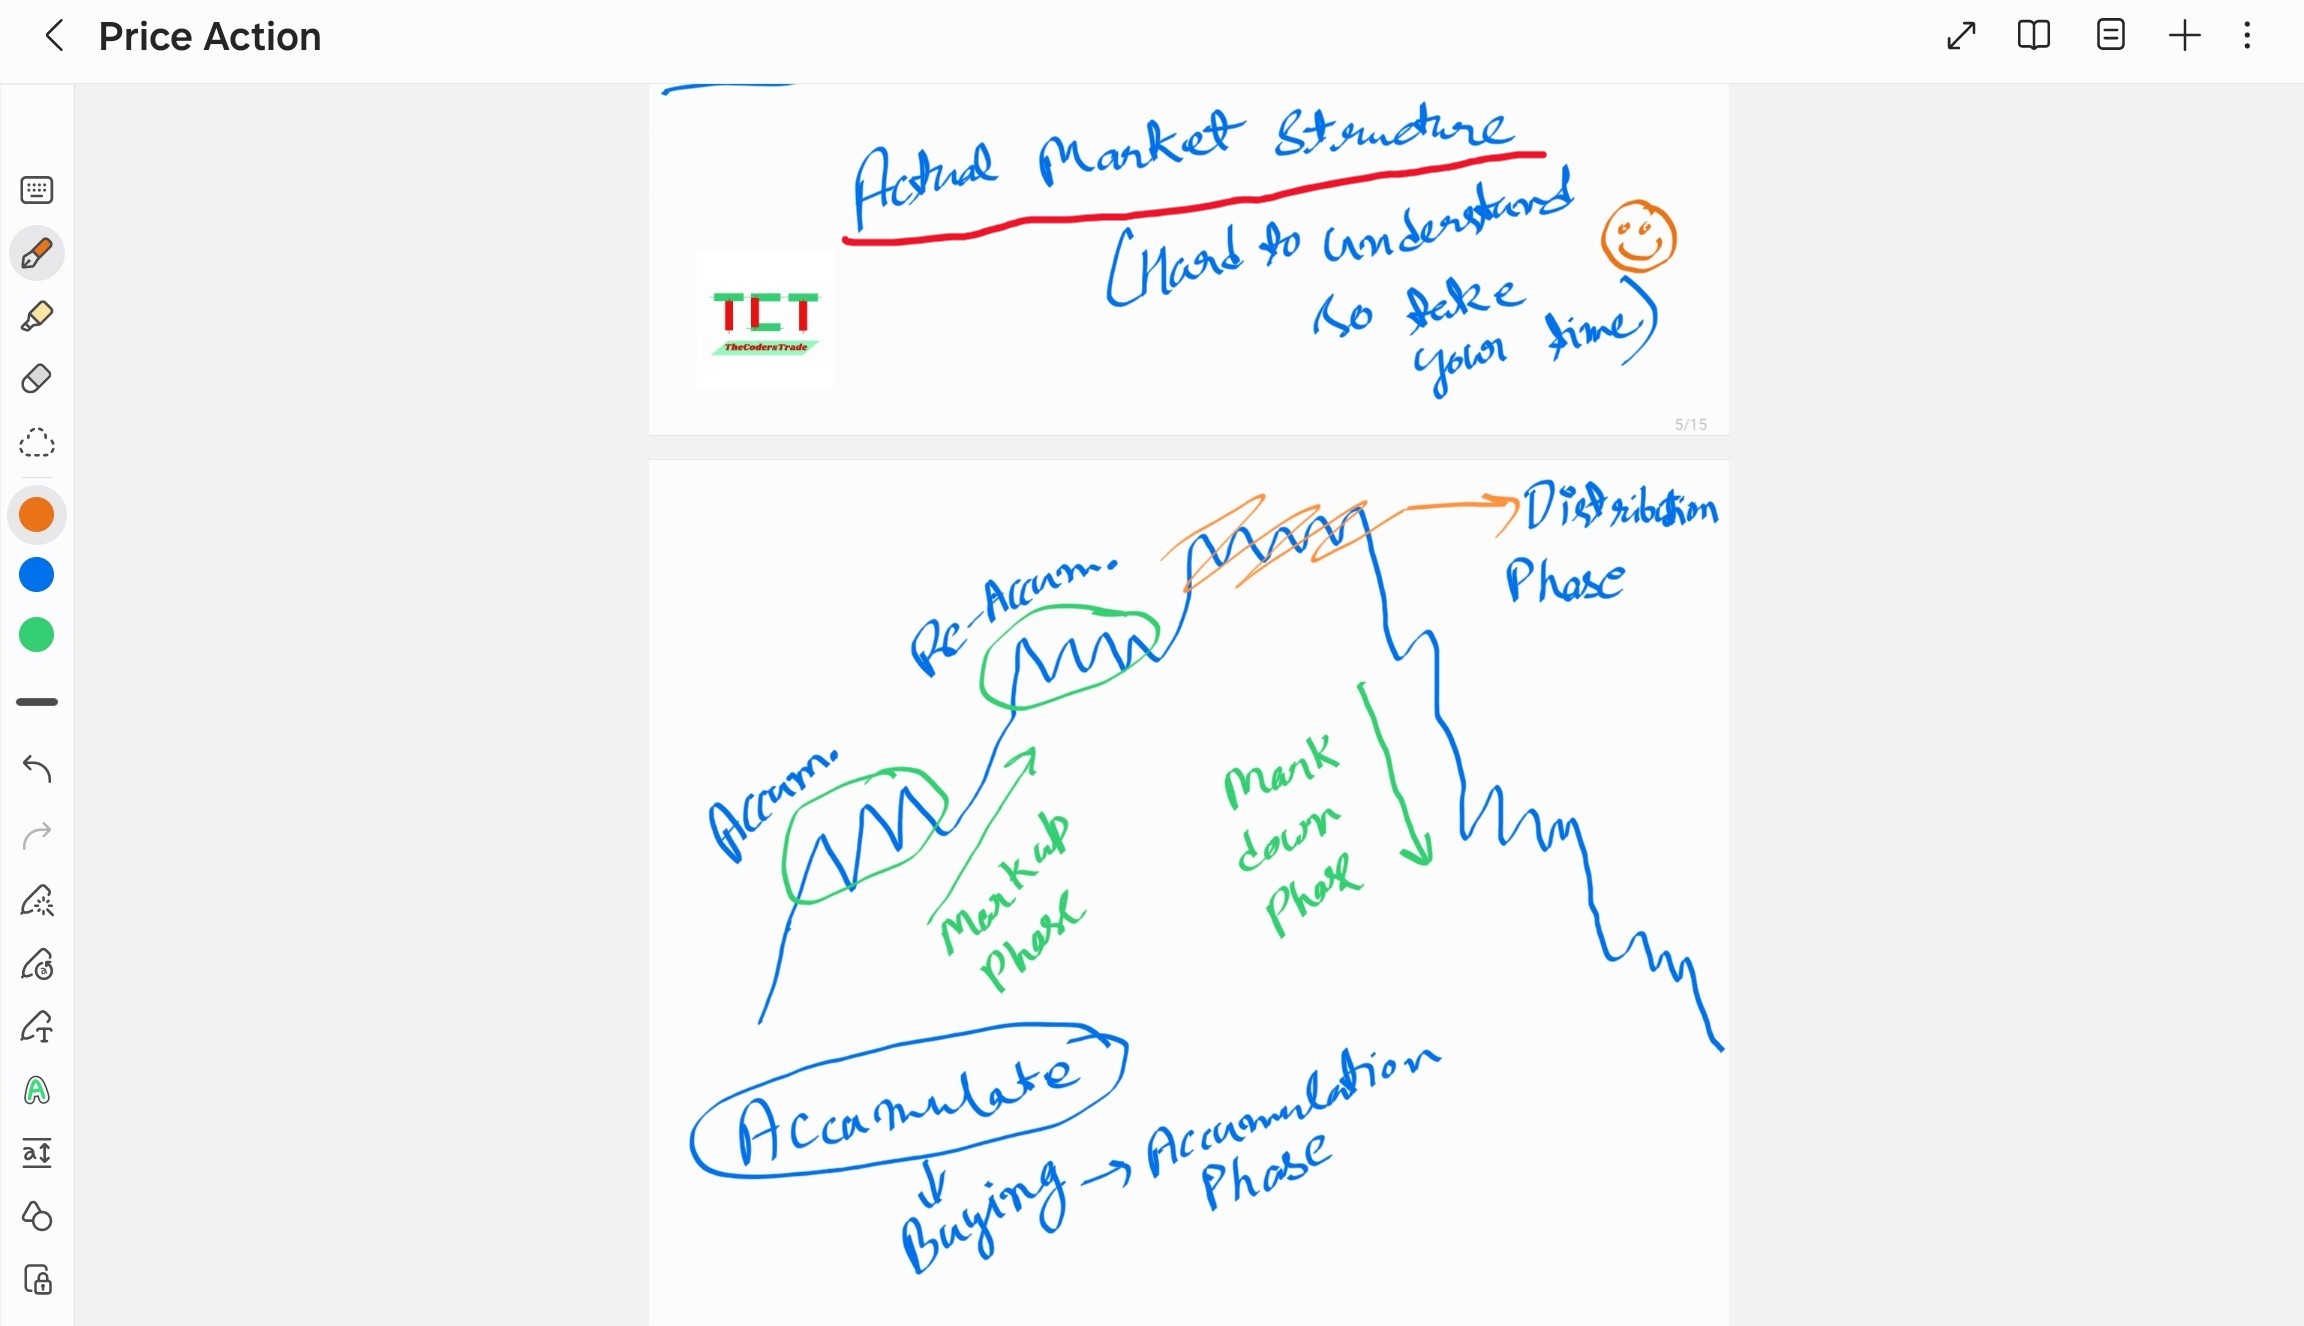
Actual Market Structure
Market structure is a representation of price action over time, while price action is the movement of prices up, down, or sideways. Market structure can be broken down into four stages: accumulation, advancing, distribution, and declining.
Markup Phase
The markup phase follows, measured by the slope of the new uptrend. Pullbacks to new support offer buying opportunities.
Markdown Phase
The slope of the new downtrend measures the markdown phase. This generates its own redistribution segments.
Market Structure Examples
Other Important Terms for Price Action
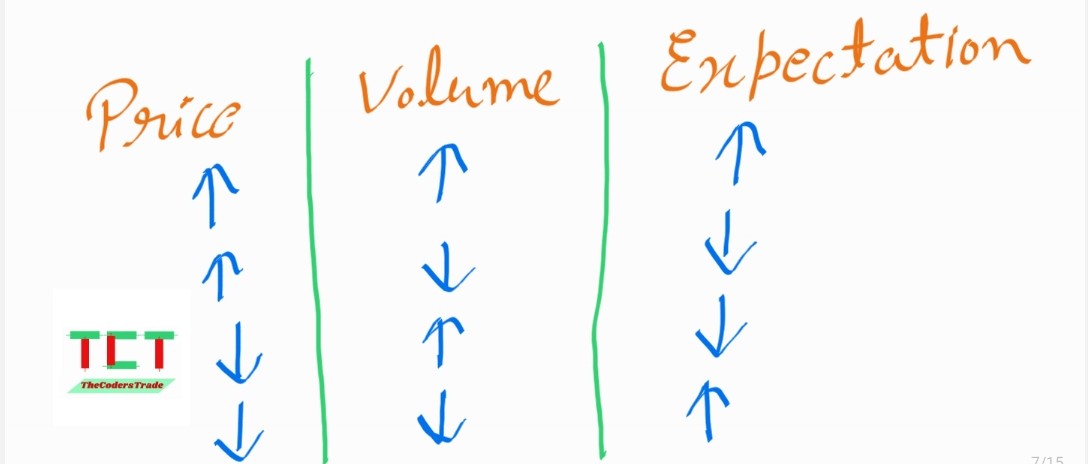
Demand & Supply → Hero of Price Action
• Demand ↑ = Supply ↓
• Supply ↑ = Price ↓
Support & Resistance
It is never just a line it is a zone i.e never make a line for support and resistance make a zone of area so that it can be easy to take entry.
FOR MORE INFO ABOUT SUPPORT AND RESISTANCE PLEASE REFER TO SUPPORT AND RESISTANCE SECTION
Candlesticks
FOR MORE INFO ABOUT CANDLESTICKS AND PATTERNS PLEASE REFER TO CANDLESTICKS SECTION
Volume
How much quantity is been traded at that moment is called volume.
Candlesticks Pattern + Support & Resistance + Volume + Chart Patterns etc.