Crypto Market Learning Index
Complete roadmap from blockchain fundamentals to decentralized finance, derivatives, and algorithmic crypto trading.
Foundation & Chart Analysis
5 ModulesCrypto Market Basics
Blockchain, wallets, tokens & exchanges
Candlestick Patterns
High-volatility crypto candlestick setups
Chart Patterns
Breakouts, trendlines & volume confirmation
Market Analysis
On-chain, fundamental & technical analysis
Support & Resistance
Dynamic liquidity levels & psychological zones
Crypto Derivatives & Whale Liquidity
4 ModulesCrypto Candlestick Architecture & Liquidation Dynamics
Deconstruct price action across 51 candlestick formations in 24/7 crypto markets. Master perpetual futures short squeezes, funding rate trap wicks, and institutional absorption zones.
Tactical Candlestick Simulator & Order-Flow Inspector
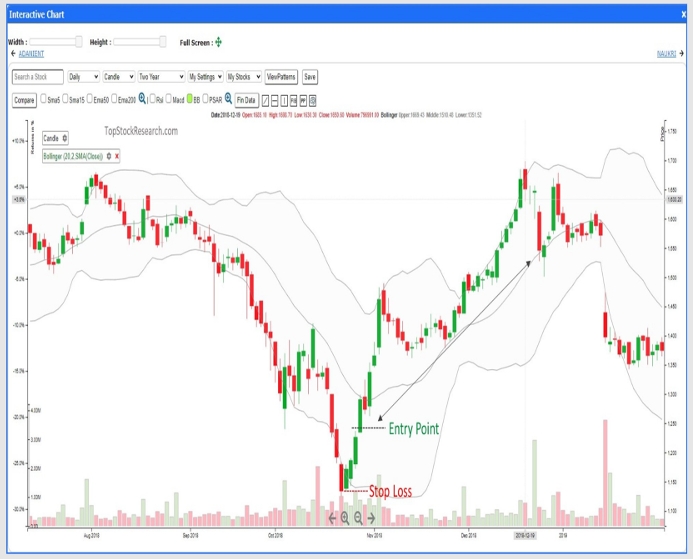
Inspect real price action dynamics, confirmed entry triggers, and stop-loss invalidation zones.
Bullish Hammer
Sellers aggressively attempted to create new lows, but heavy spot and institutional limit orders absorbed the dump, forcing price back to open.
Execution Rules
Smart Money / Liquidity Trap Note
Retail traders who shorted the breakdown get caught off-guard as their buy stops accelerate the ensuing rally.
Crypto Candlestick Mechanics
Understanding liquidation wicks, perp funding, and 24/7 price discovery
Bullish Liquidation Wick (Spot Absorption)
Aggressive AbsorptionPrice dips below previous cycle lows to trigger cascading stop-losses on over-leveraged longs. Institutional spot buyers absorb the liquidity and drive price back above the open, printing a long lower wick.
Bearish Short Squeeze Exhaustion (Supply Dumping)
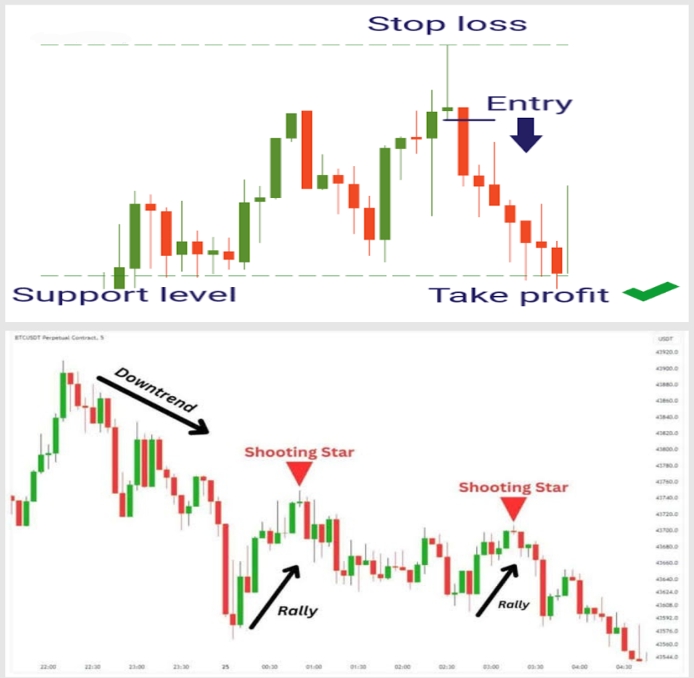
Climactic PeakPrice pumps violently into overhead resistance, liquidating perpetual shorts. Once liquidity is consumed, market makers dump spot inventory, leaving an elongated upper wick (Shooting Star).
• 24/7 No Gaps: Unlike traditional equities, crypto has minimal weekend gaps on spot charts, making intra-candle wick rejections far more informative for trend continuations.
• CVD Divergence: Always pair candlestick patterns with Cumulative Volume Delta to verify whether market buyers or market sellers initiated the volume surge.
• Funding Traps: If funding is deeply negative and price prints a bullish hammer at support, the probability of a violent squeeze increases by 40%+.
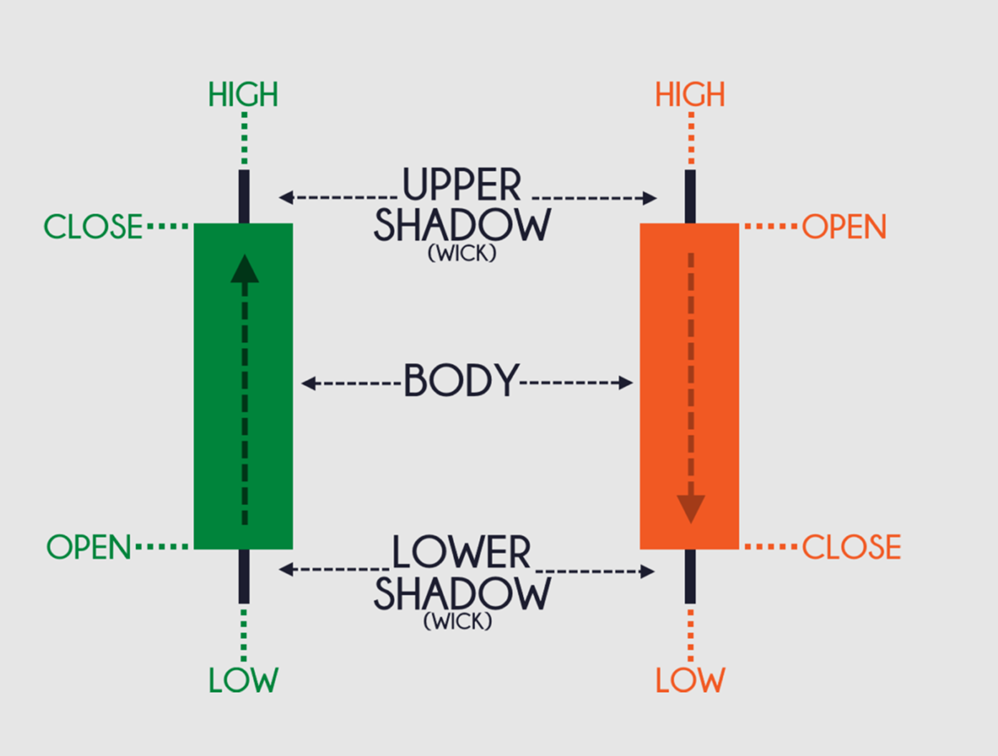
Comprehensive Pattern Breakdown
Displaying 51 institutional patterns across active filters.
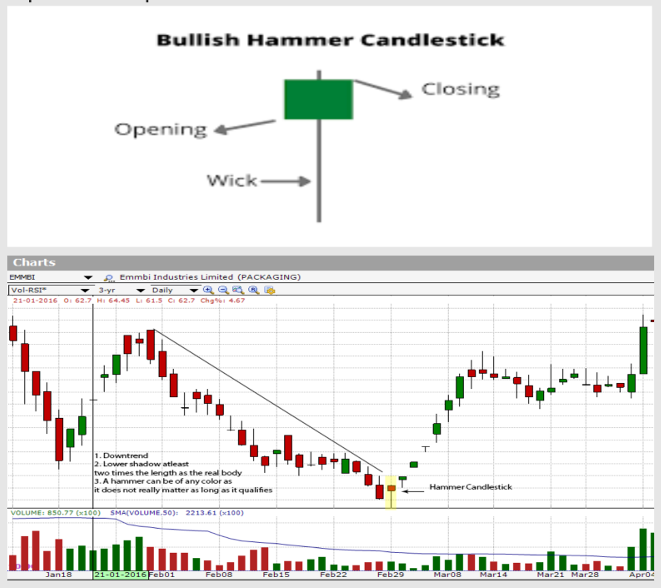
1. Hammer Pattern
Characterized by a small body near the top of the candle with a long lower shadow (at least 2x body height). Signals strong price rejection at key support.
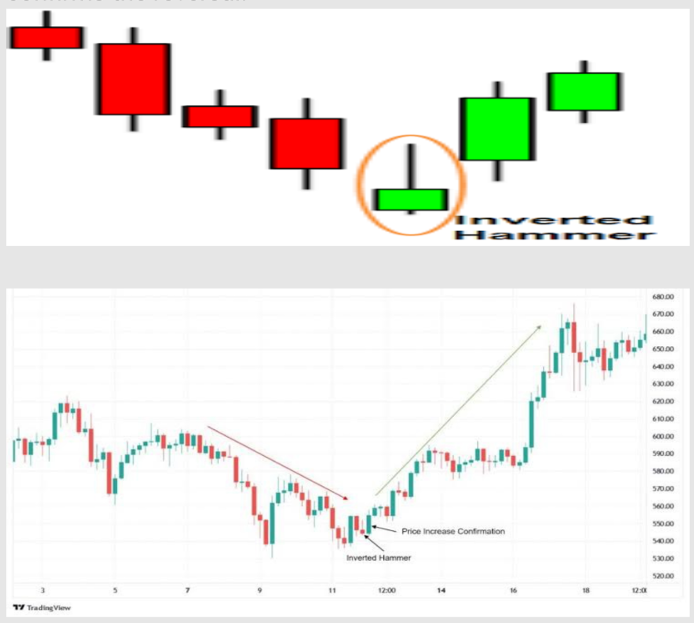
2. Inverted Hammer Pattern
Appears at the bottom of a downtrend with a small lower body, long upper wick, and little to no lower wick.
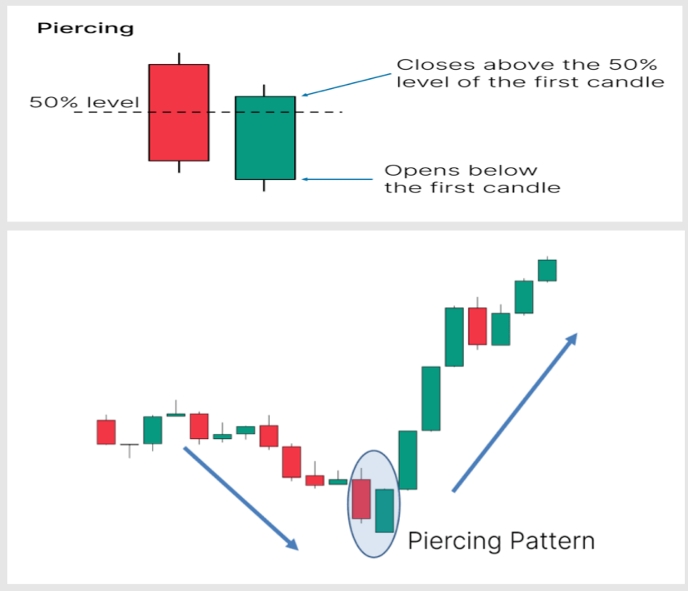
3. Piercing Line Pattern
A two-candle reversal formation. A bearish candle followed by a candle opening lower but closing above the 50% midpoint of the prior candle.
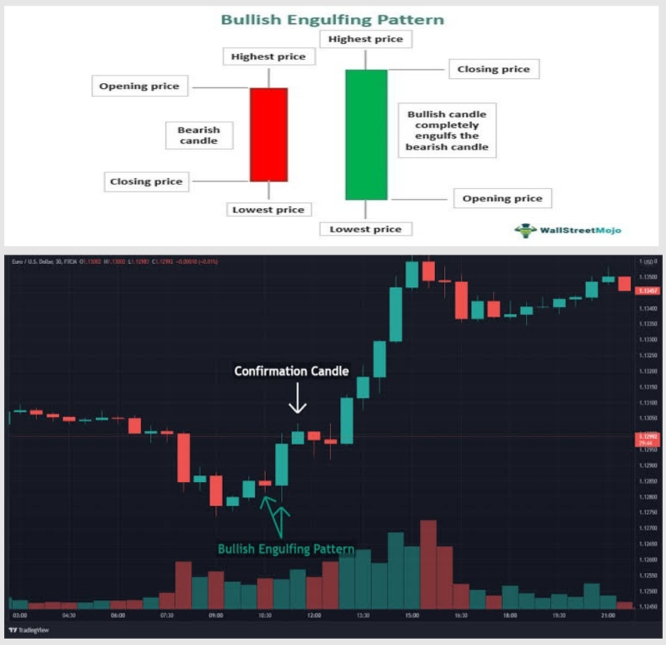
4. Bullish Engulfing Pattern
A small red candle followed by a larger green candle whose real body completely engulfs the prior session's body.
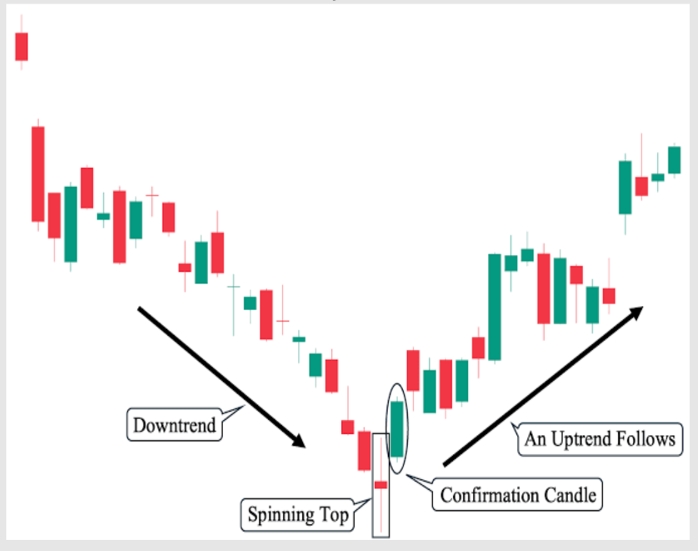
5. Bullish Spinning Top
Compact body positioned symmetrically between long upper and lower shadows.
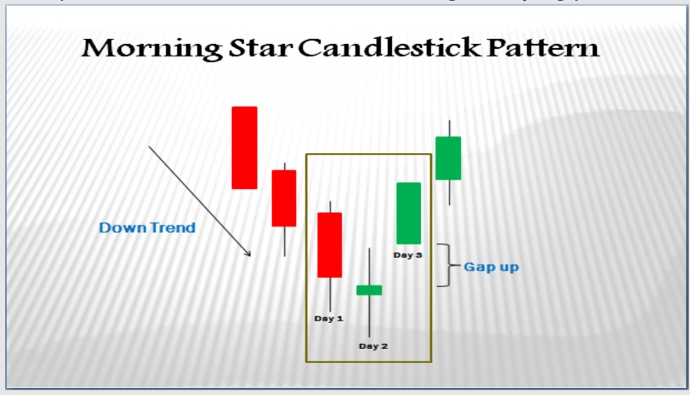
6. The Morning Star Pattern
A three-candle bottom formation: long red candle, small gapping star candle, and a strong third green candle.
7. Three White Soldiers
Three consecutive long-bodied green candles with short wicks, each opening inside the prior body and closing near highs.
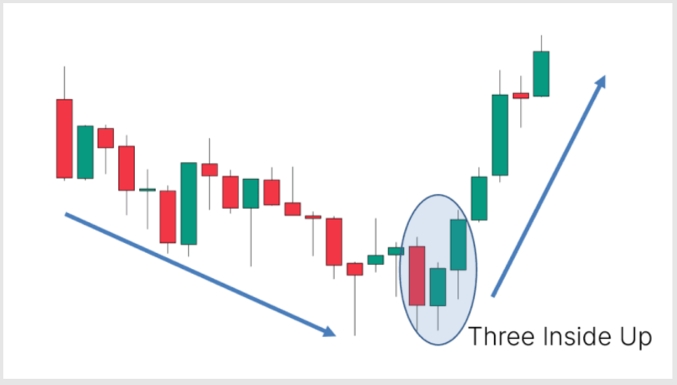
8. Three Inside Up Pattern
A large red candle, a small green candle inside it, and a third candle closing above the first candle's high.
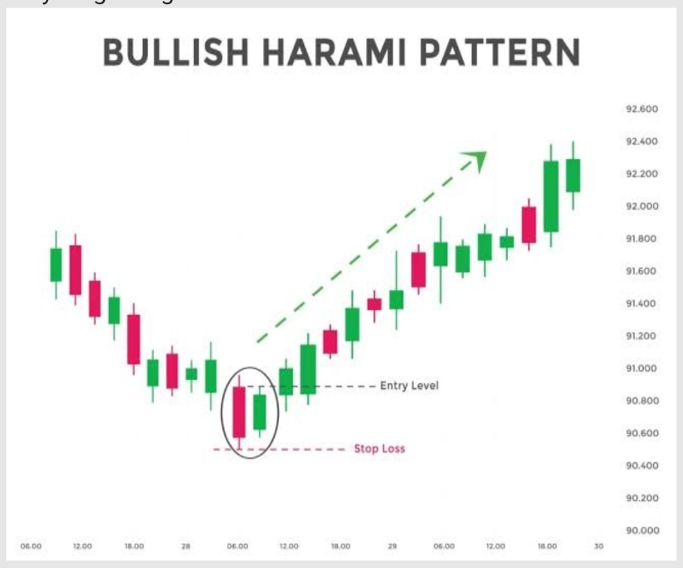
9. Bullish Harami Pattern
A small green candle forms completely within the real body of the preceding large red candle.
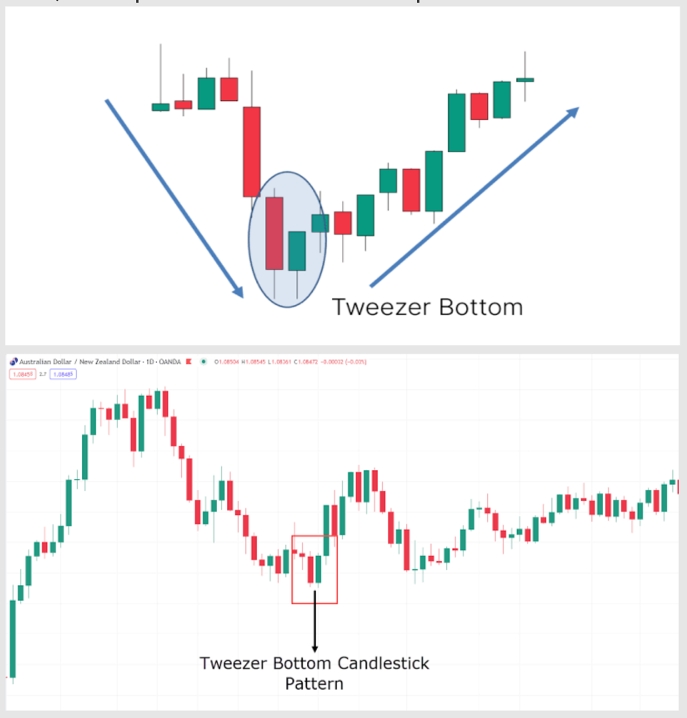
10. Tweezer Bottom Pattern
Two or more candles sharing the exact same low price point at an established support zone.
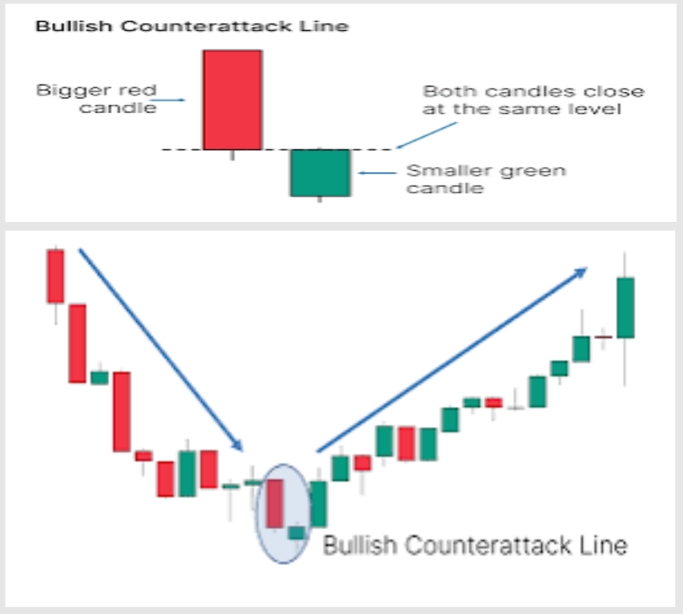
11. Bullish Counterattack Pattern
A down candle followed by a gap-down open that rallies sharply to close at the prior day's close.
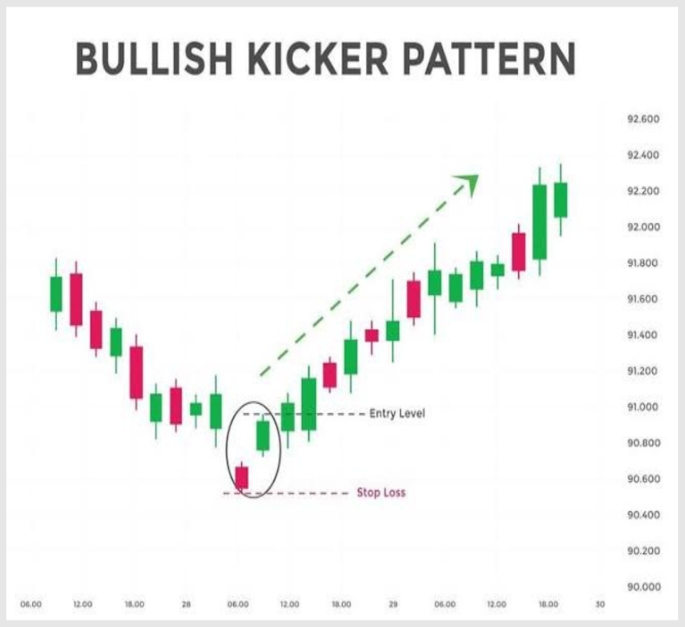
12. Bullish Kicker Pattern
A red candle followed immediately by an upward-gapping green candle that never looks back.
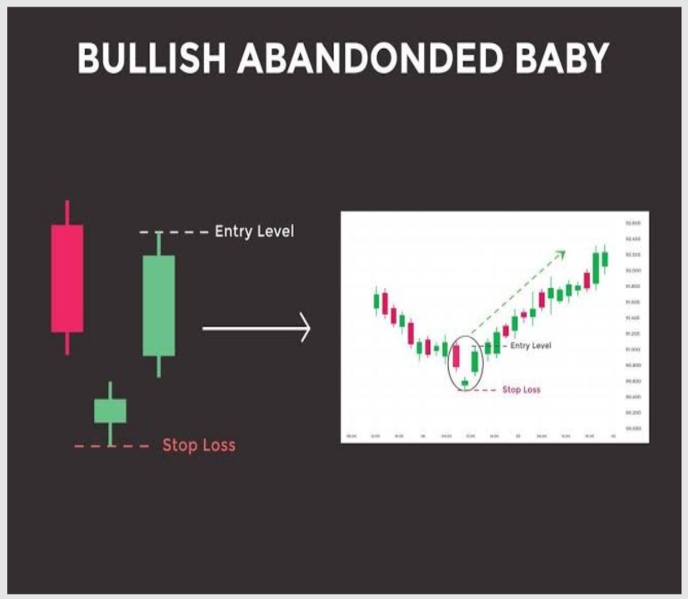
13. Bullish Abandoned Baby
A long red candle, a doji gapping down with no shadow overlap, and a green candle gapping upward.
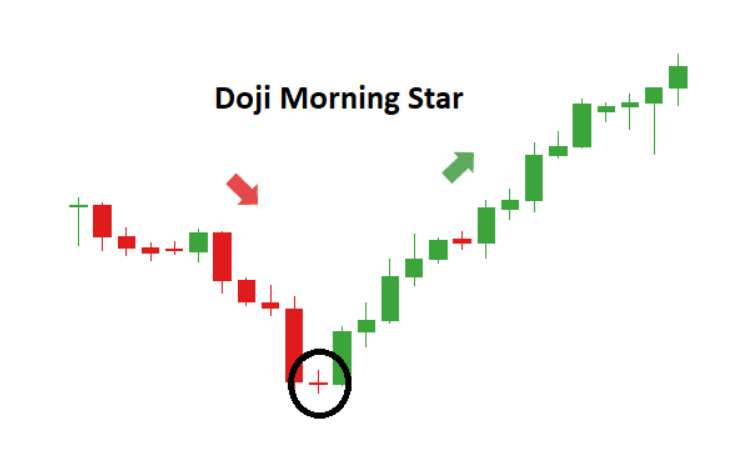
14. Morning Star Doji
Morning star variation featuring a doji as the pivot candle.
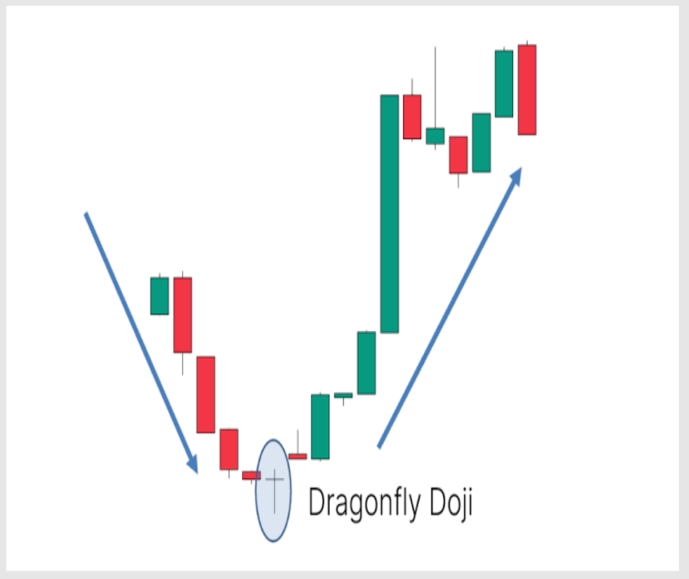
15. Dragonfly Doji Pattern
Open, high, and close are equal at the top with an exceptionally long lower shadow.
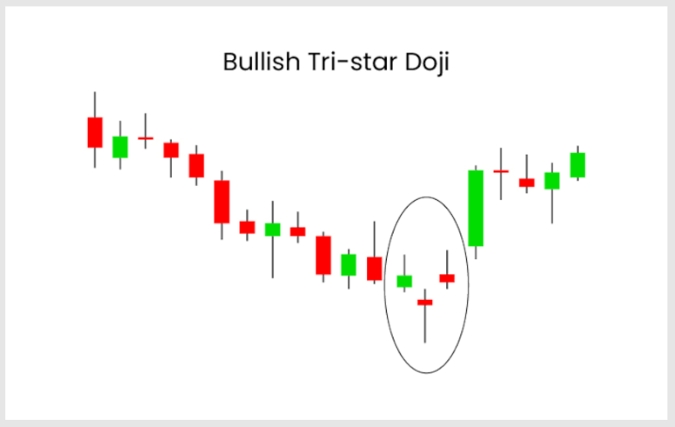
16. Bullish Tri-Star Pattern
Three consecutive dojis appearing at market bottoms, with the middle doji marking the low.
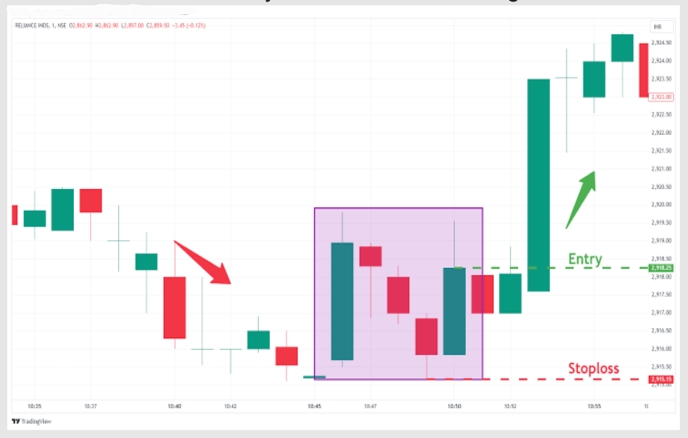
17. Bullish Hikkake Pattern
An inside bar breaks down falsely before reversing violently upward to trap sellers.
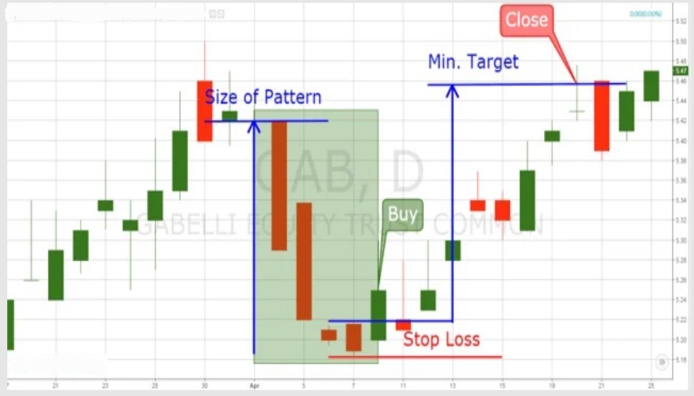
18. Concealing Baby Swallow
A rare 4-candle bottom formation signaling severe seller depletion.
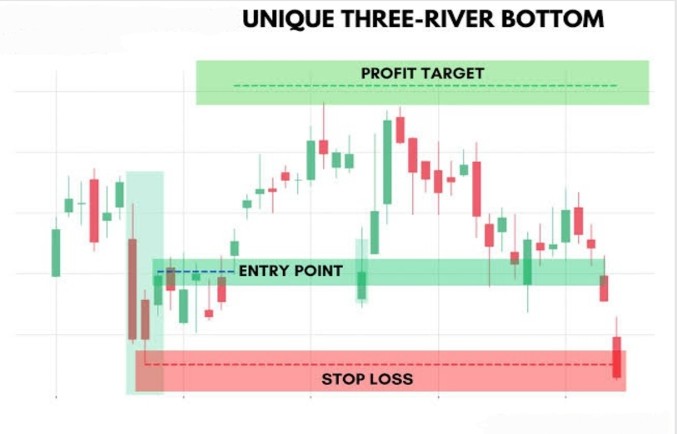
19. Unique Three Rivers Pattern
A long down candle, a lower-shadow hammer, and a small green stabilizing candle.
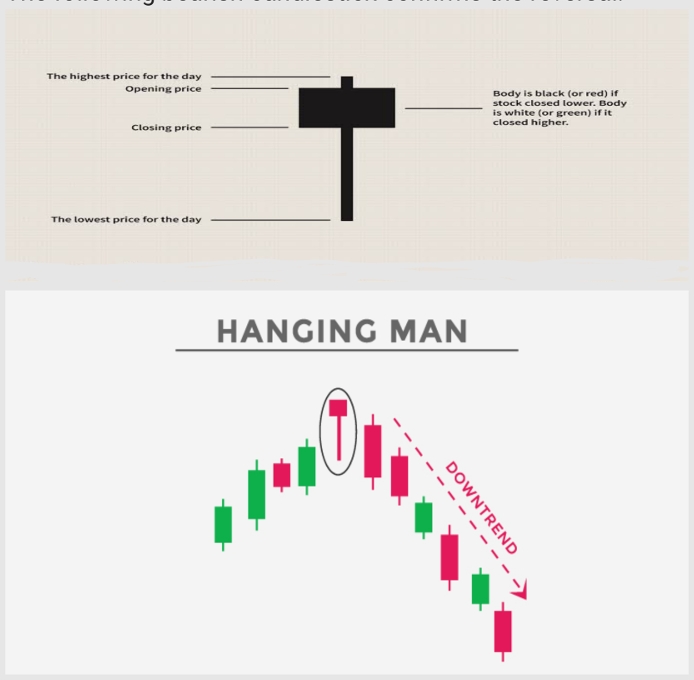
20. Hanging Man Pattern
Appears at the peak of an uptrend with a small body at the top and a long lower tail.
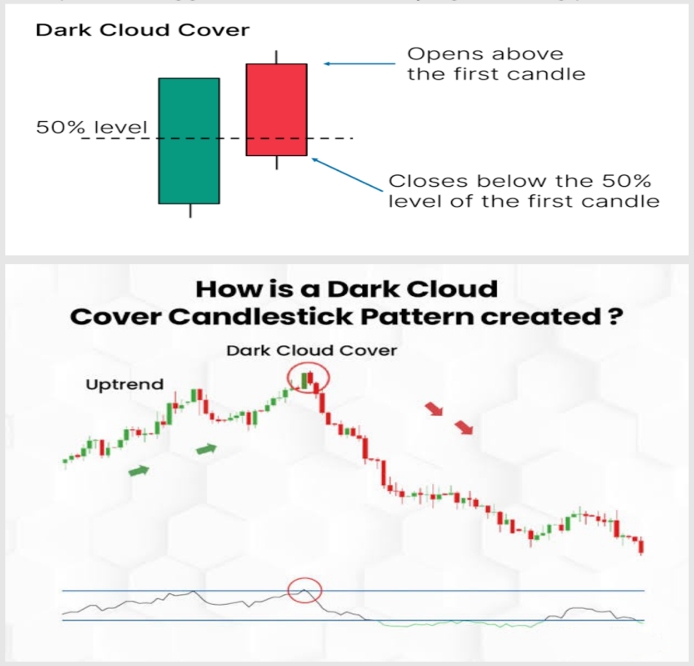
21. Dark Cloud Cover Pattern
A strong bullish candle followed by a candle opening higher but closing below the 50% midpoint.
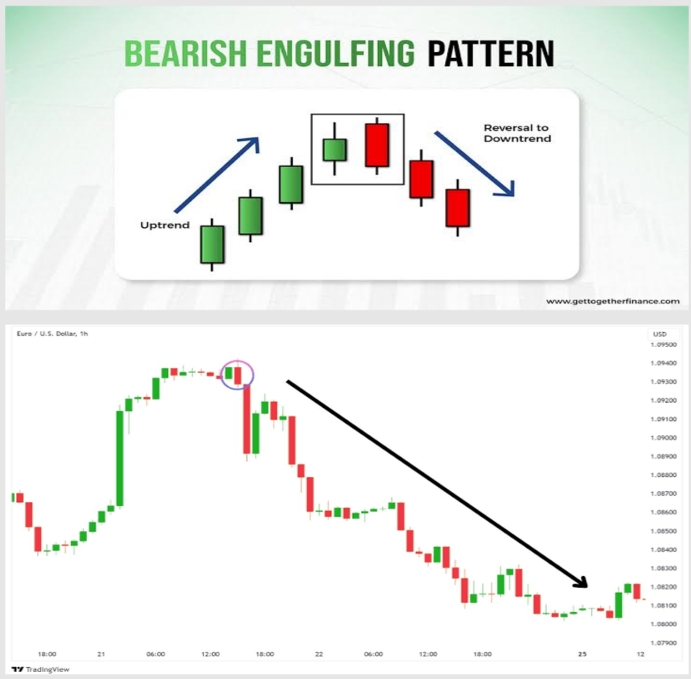
22. Bearish Engulfing Pattern
A green candle followed by a larger red candle whose body completely engulfs the prior candle.
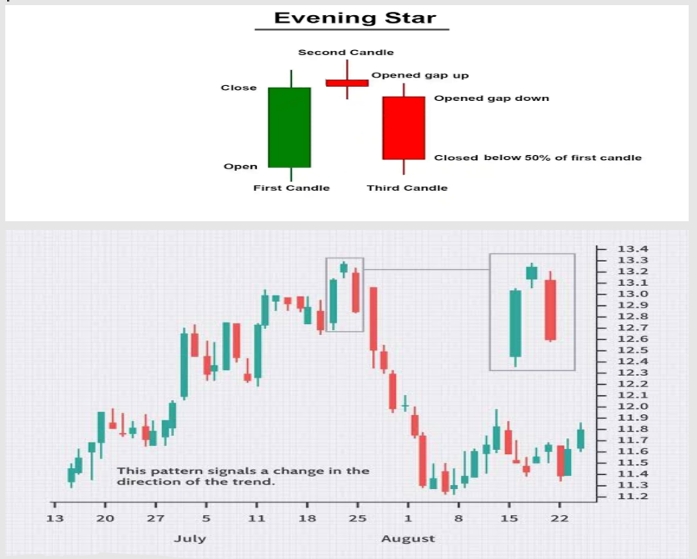
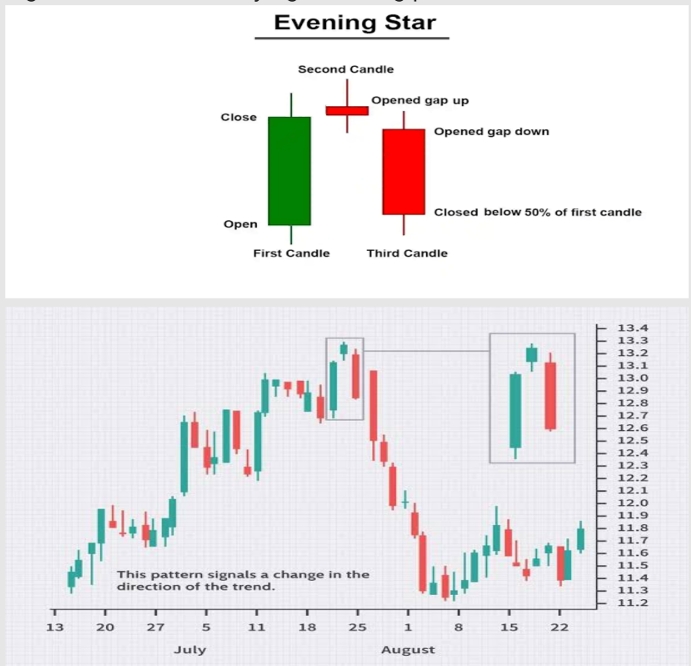
23. The Evening Star Pattern
A three-candle top formation: long green candle, an isolated star, and a heavy third red candle.
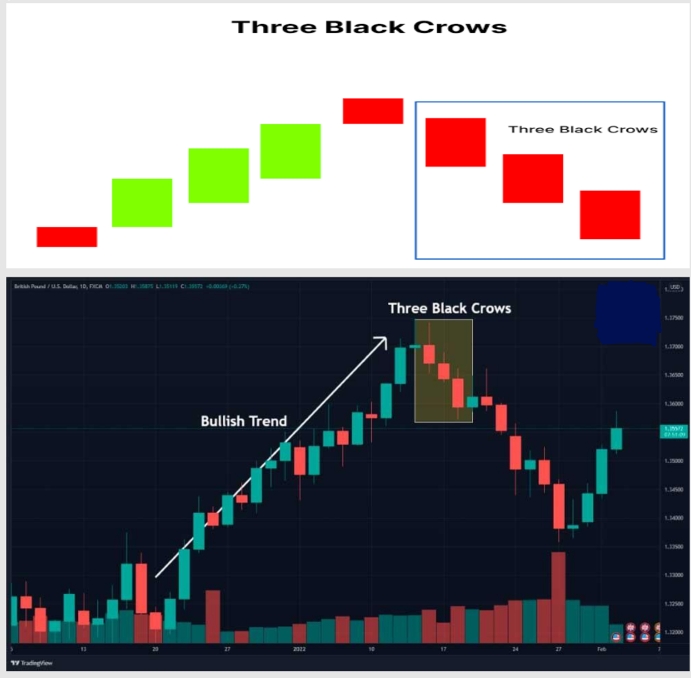
24. Three Black Crows Pattern
Three consecutive long-bodied red candles closing at or near lows.
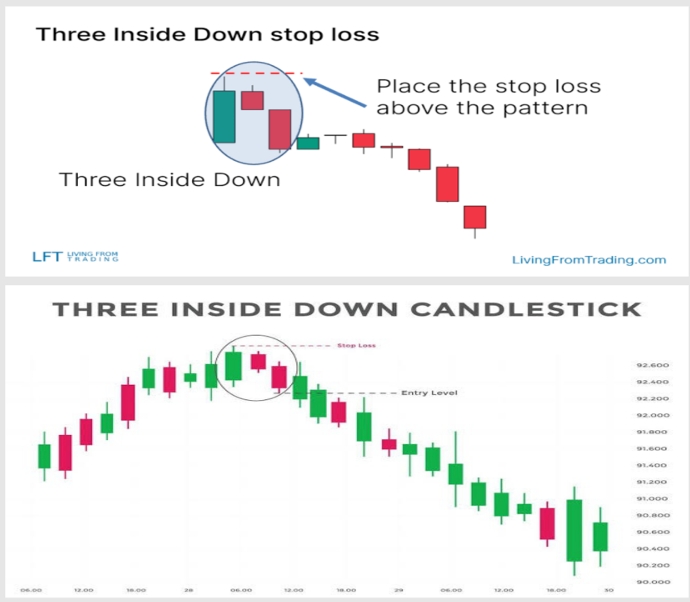
25. Three Inside Down Pattern
A tall green candle, a small red candle inside it, and a third red candle closing below candle one.
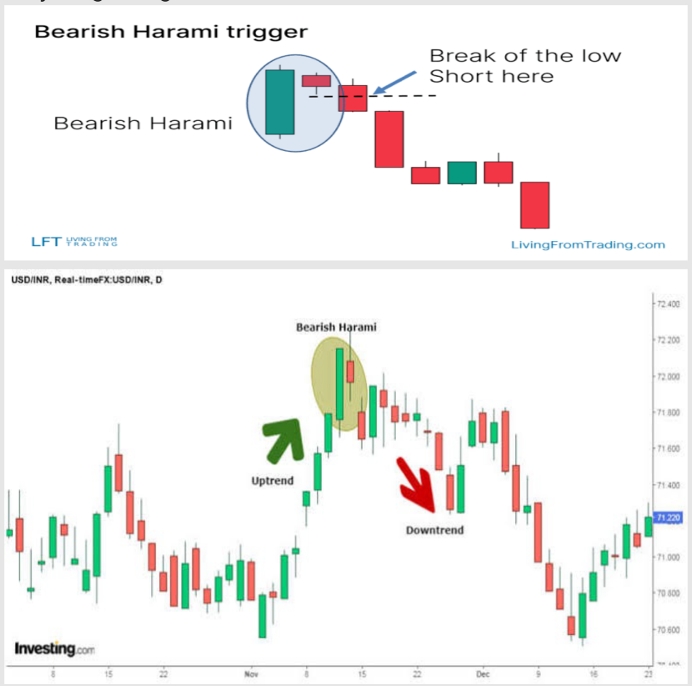
26. Bearish Harami Pattern
A small red candle contained inside the large preceding green candle.
27. Shooting Star Pattern
Small lower body with a long upper wick (2x+ body length) and little to no lower wick.
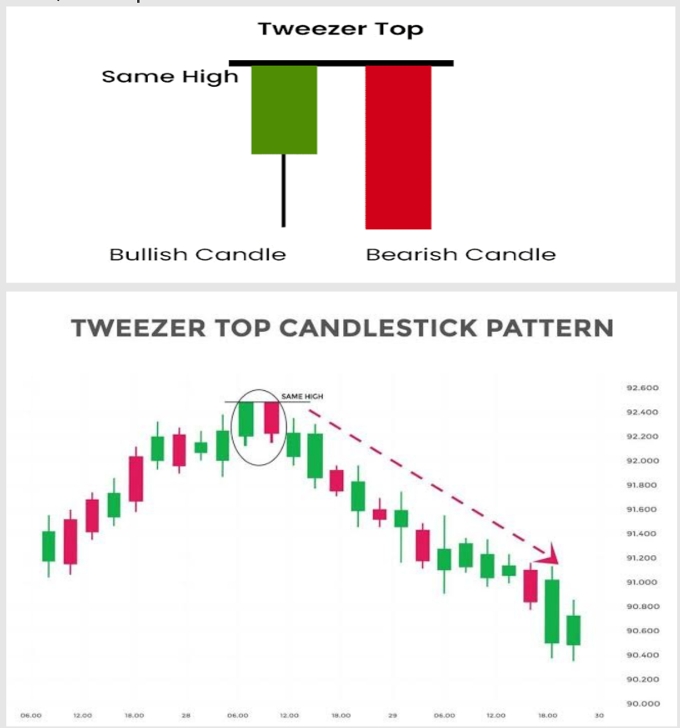
28. Tweezer Top Pattern
Two or more candles sharing the exact same high price point at an established resistance level.
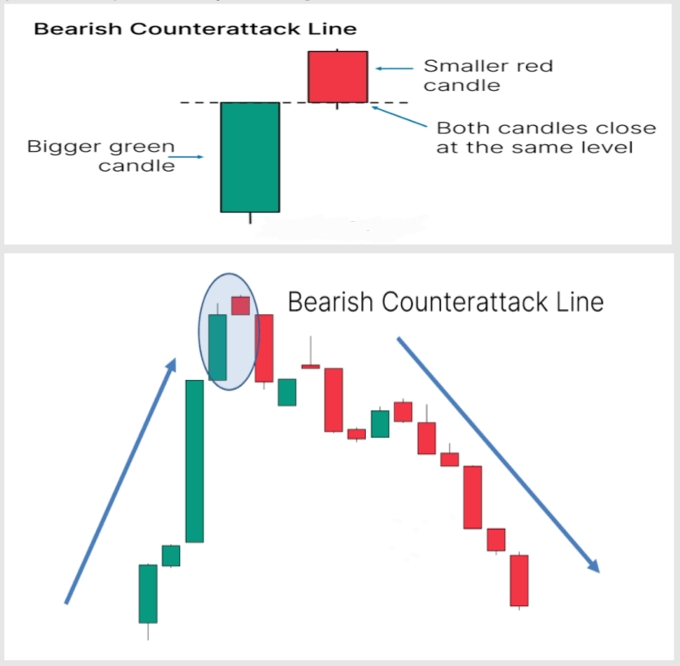
29. Bearish Counterattack Pattern
A gap up is immediately countered by an aggressive selloff that closes at the prior day's close.
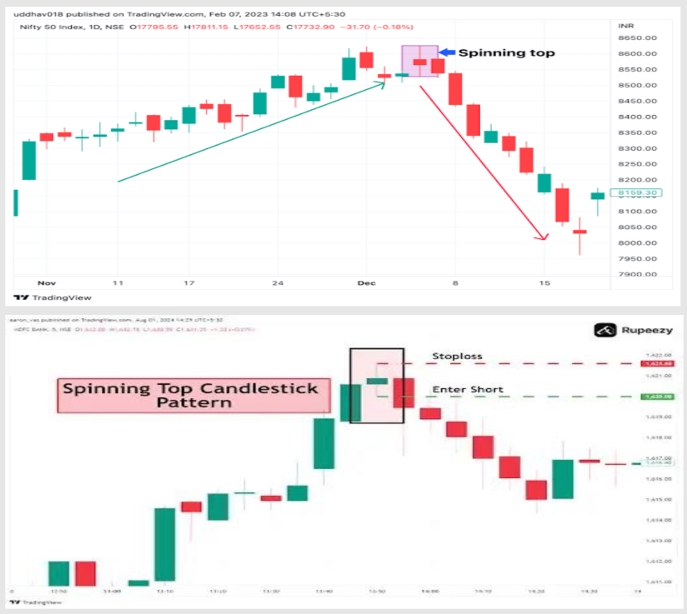
30. Bearish Spinning Top
Symmetric long wicks with a tight body following an extended rally.
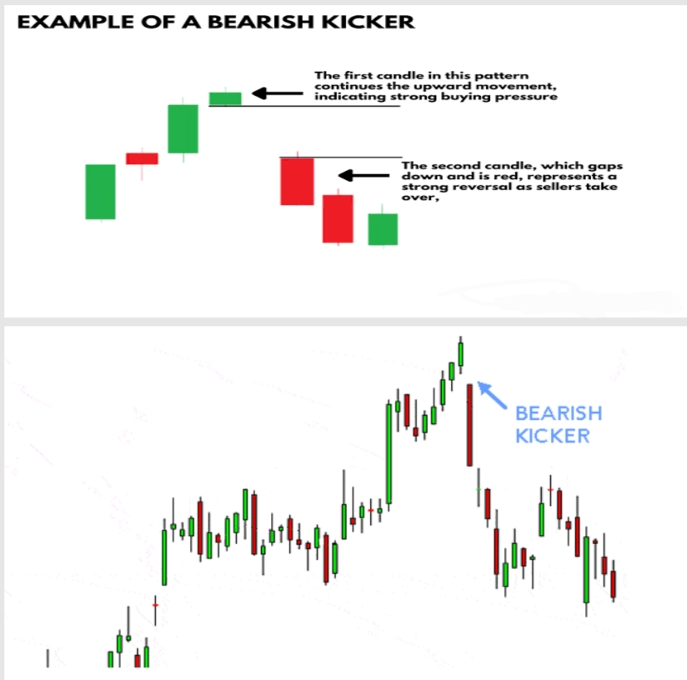
31. Bearish Kicker Pattern
A bullish candle followed immediately by a downward-gapping red candle that plunges lower.
32. Evening Star Doji Pattern
An evening star whose middle candle is a Doji.
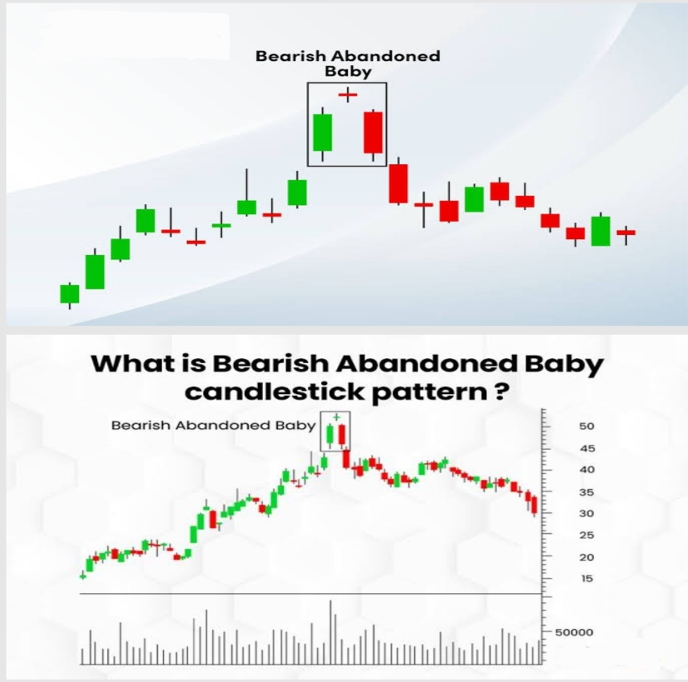
33. Bearish Abandoned Baby
A green candle, an isolated doji gapping up with no shadow overlap, and a red candle plunging down.
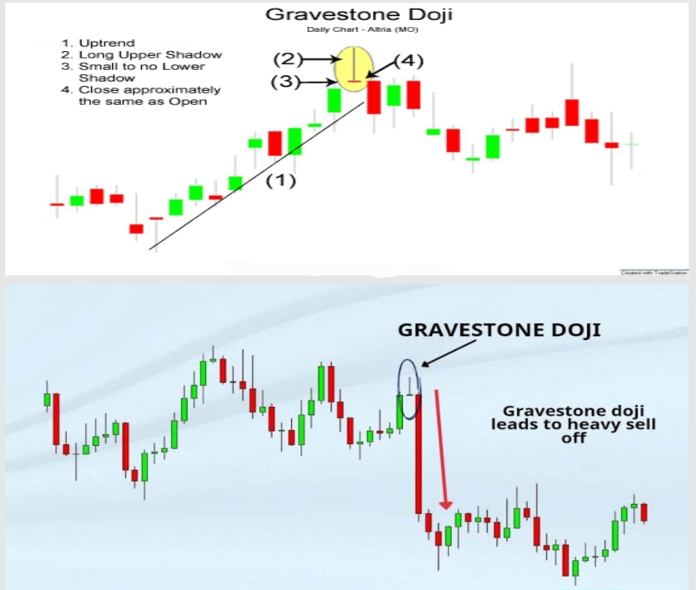
34. Gravestone Doji Pattern
Open and close are at the low of the session with an exceptionally long upper shadow.
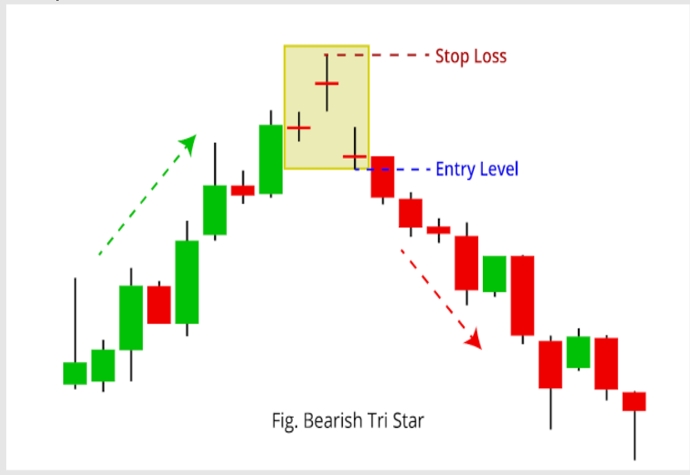
35. Bearish Tri-Star Pattern
Three consecutive Dojis at the summit of a bull market.
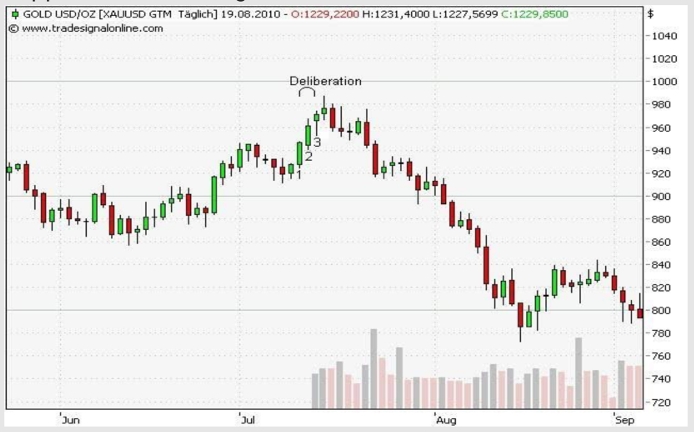
36. Deliberation Pattern
Three green candles where the first two are expansive and the third shrinks into a tiny body.
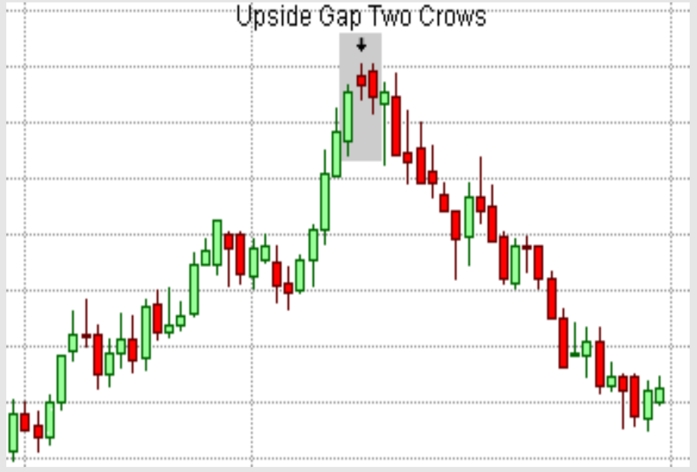
37. Upside Gap Two Crows
A rare bearish reversal formation during an extended uptrend.
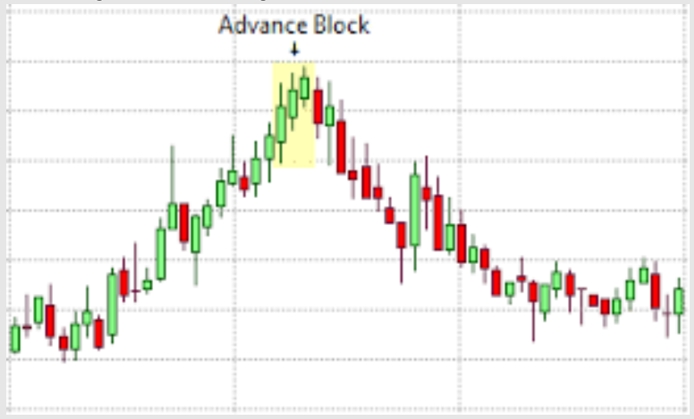
38. Advance Block Pattern
Three advancing green candles with progressively smaller real bodies and longer upper wicks.
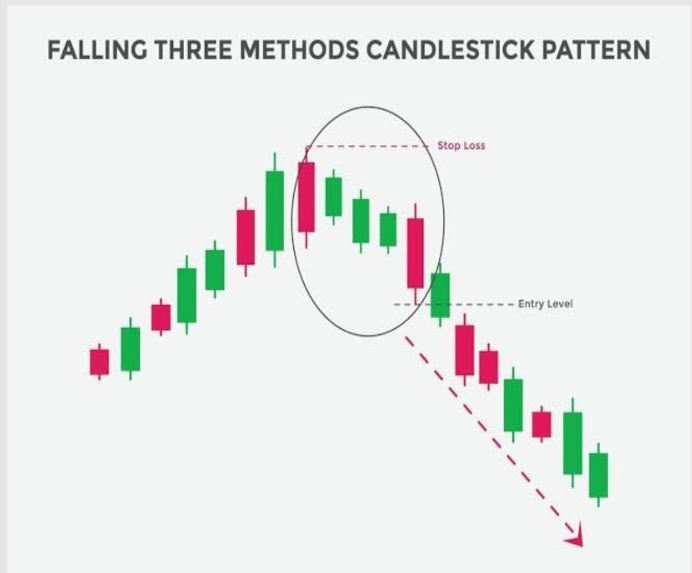
39. Falling Three Methods
A long red candle, three small green consolidation candles, and a heavy fifth breakdown candle.
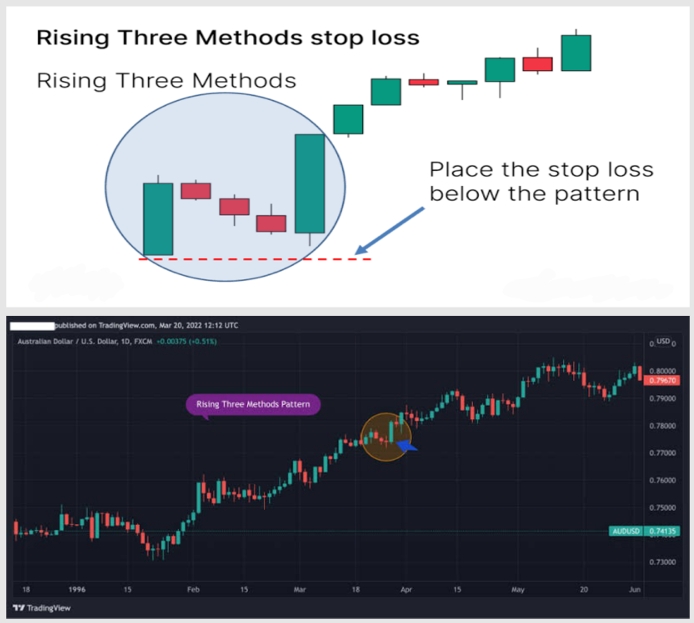
40. Rising Three Methods
A long green candle, three small red consolidation candles, and a strong fifth breakout candle.
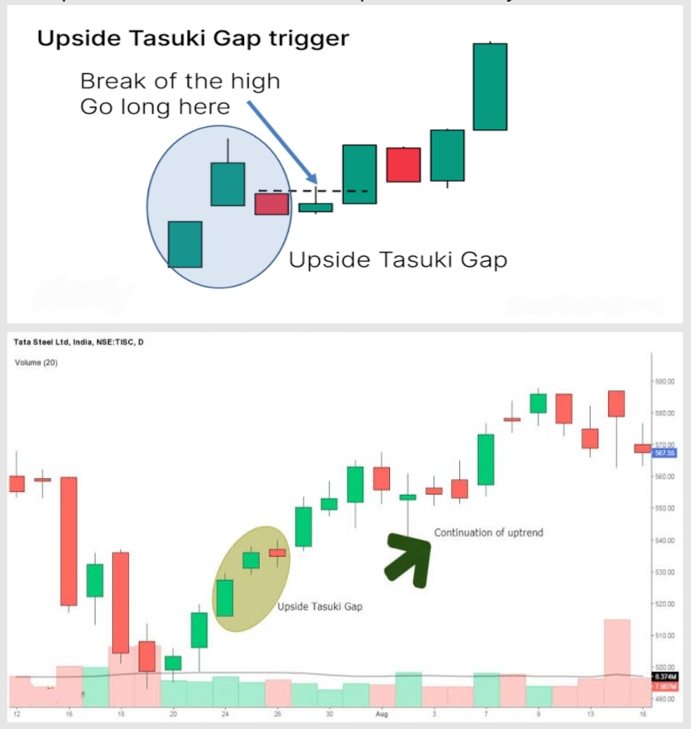
41. Upside Tasuki Gap
In an uptrend, a green candle gaps up, followed by a red candle that tests the gap without closing it.
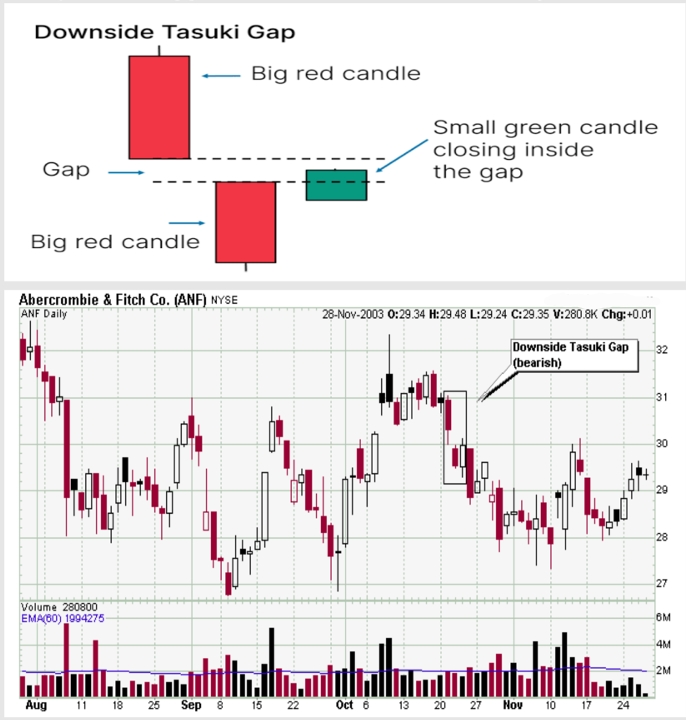
42. Downside Tasuki Gap
In a downtrend, a red candle gaps down, followed by a green candle that retraces into the gap without filling it.
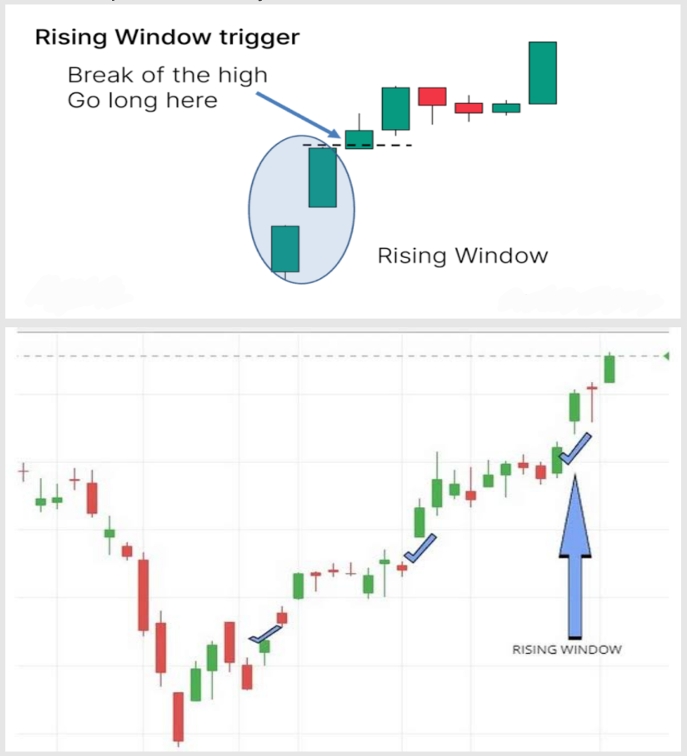
43. Rising Window Pattern
A price gap between two green candles with no overlapping shadows.
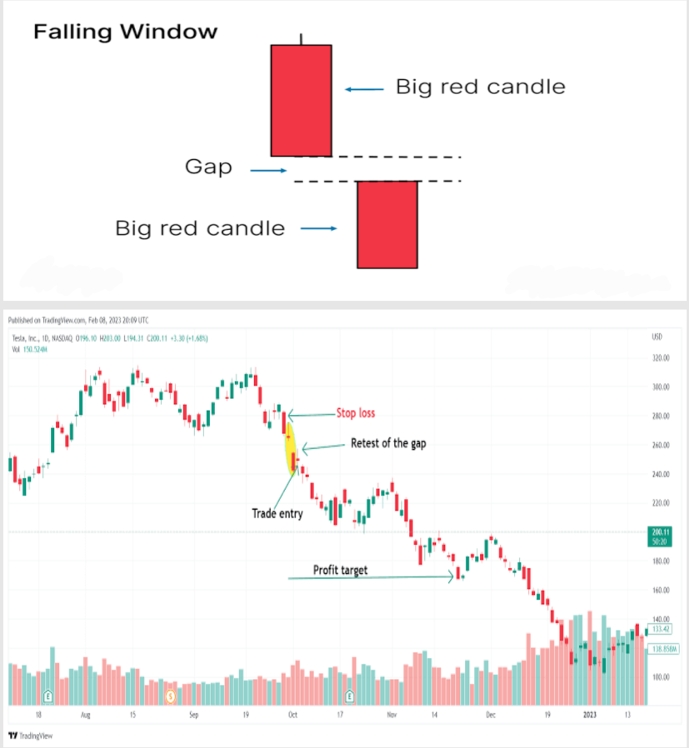
44. Falling Window Pattern
A downward price gap between two consecutive red candles.
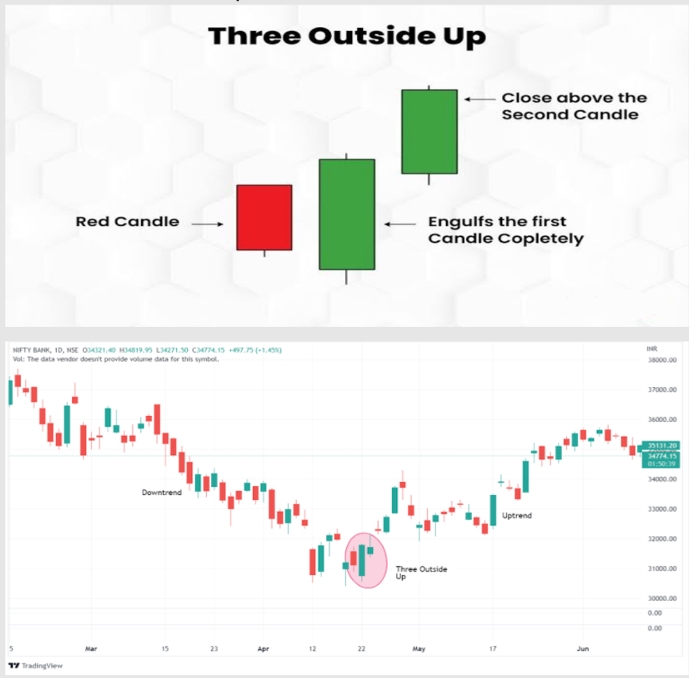
45. Three Outside Up Pattern
A bullish engulfing pattern followed by a third green candle closing higher.
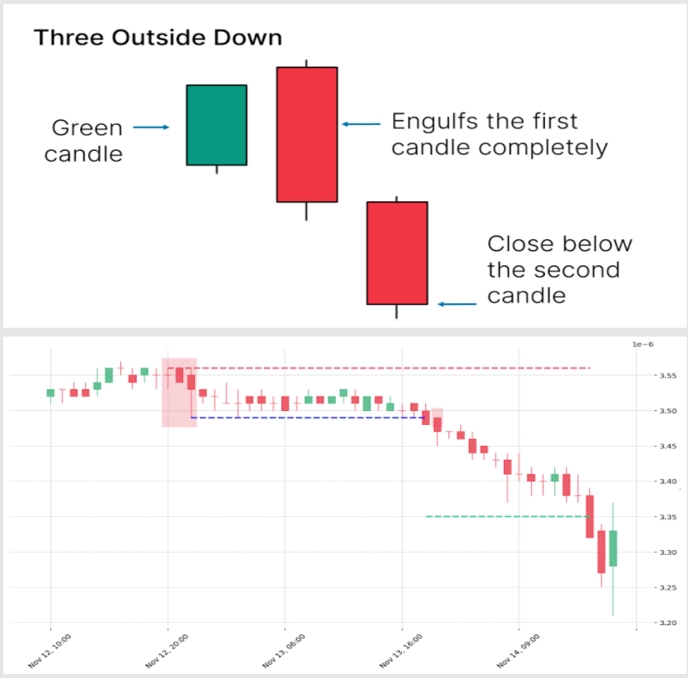
46. Three Outside Down
A bearish engulfing pattern followed by a third red candle closing lower.
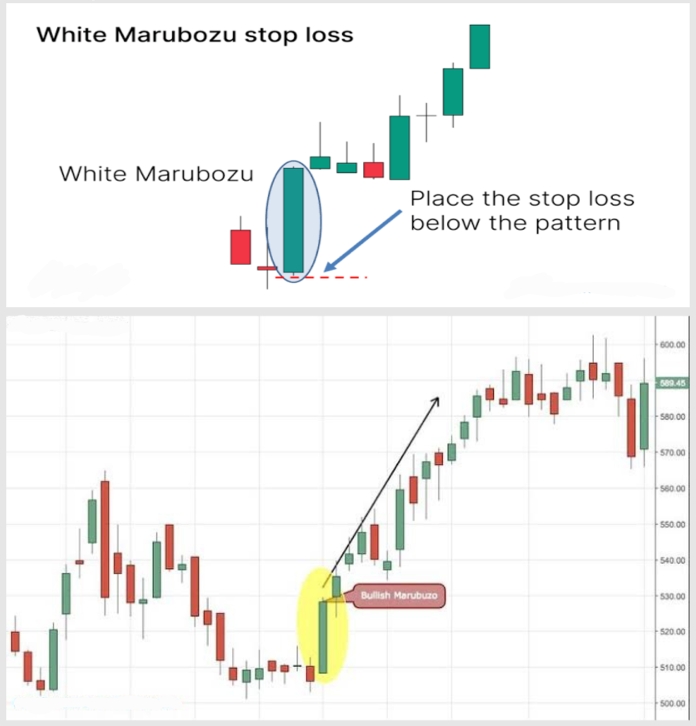
47. White Marubozu Pattern
A long green candle with zero wicks.
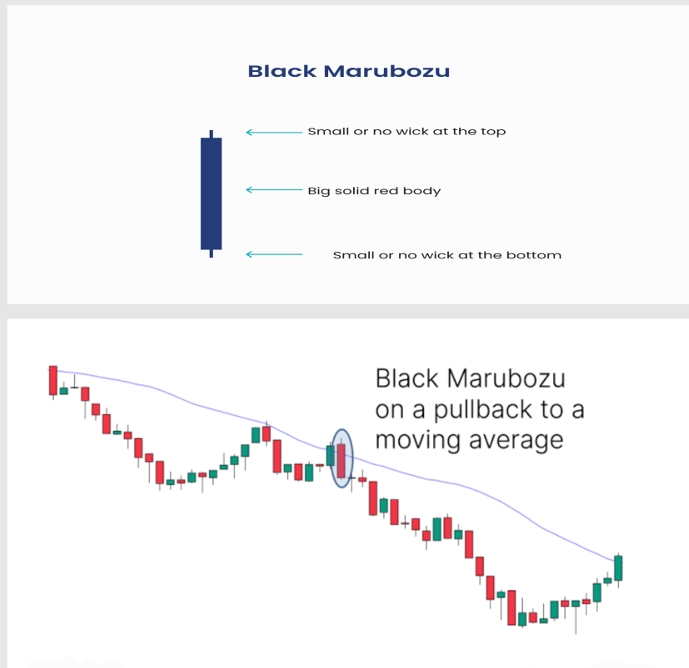
48. Black Marubozu Pattern
A long red candle with zero wicks.
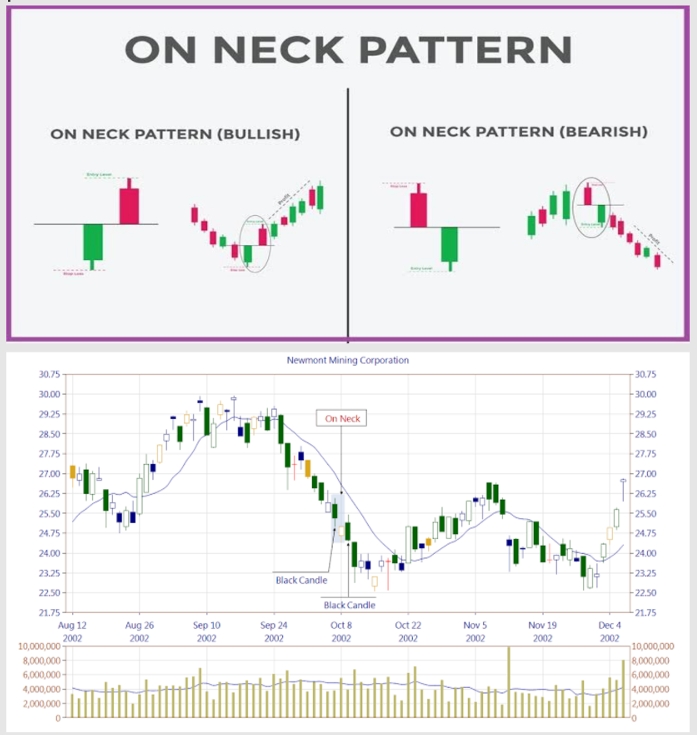
49. On-Neck Pattern
In a downtrend, a red candle is followed by a green candle that only closes at the prior candle low.
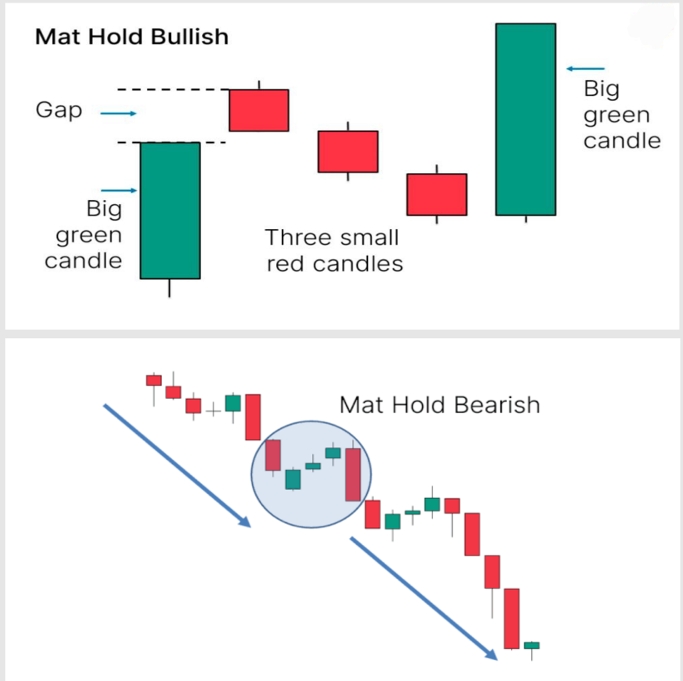
50. Mat-Hold Pattern
Similar to rising three methods, but the reaction starts with an upward gap.
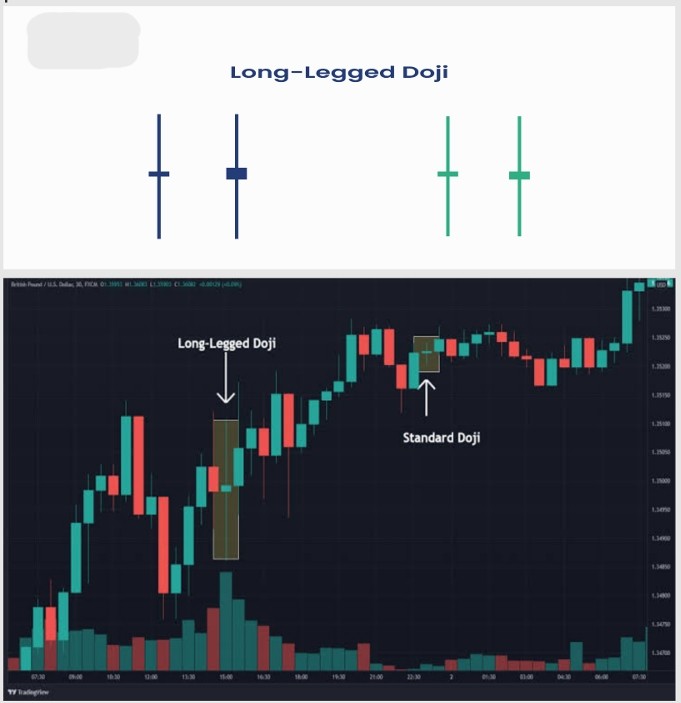
51. Long Legged Doji
Features long shadows in both directions with open and close identical in the center.
Crypto Execution Realities & Liquidity Traps
Protecting digital asset capital against false breakout stop-hunts
Funding Rate & Liquidation Hunting
When perpetual futures funding rates reach extreme positive levels (+0.05%+), market makers sweep resting long stops beneath support before allowing price to climb. Never enter without confirmation.
Exchange Liquidity Variance
Binance, Bybit, Coinbase, and OKX print divergent candlestick wicks during high-volatility releases due to order book depth. Always cross-reference high time-frame charts across aggregate feeds.
Bitcoin Beta Sensitivity
Regardless of how pristine an altcoin's bullish candlestick pattern appears, an abrupt 3% BTC liquidation wick will breach support across 95% of altcoins simultaneously.
Volume Climax Requirement
Reversal candlesticks without spot volume surges often represent low-liquidity drift rather than institutional accumulation. Look for rising Open Interest alongside volume spikes.