
Crypto Market Learning Index
Complete guide to master cryptocurrency trading
Foundation Concepts
Advanced Trading
Crypto Analysis
Master comprehensive cryptocurrency analysis techniques. Learn technical analysis, fundamental analysis, on-chain metrics, and price action to make informed trading decisions in the volatile crypto markets.
1. What is Crypto Analysis?
Cryptocurrency analysis is the comprehensive process of evaluating digital assets to determine their potential price movements, investment value, and market trends. Unlike traditional assets, crypto analysis combines classical financial analysis with blockchain-specific metrics, sentiment analysis, and understanding of decentralized technology.
Technical Analysis
Study price charts, patterns, and indicators to predict future movements in 24/7 markets
Fundamental Analysis
Evaluate project technology, tokenomics, team, real-world utility, and adoption metrics
On-chain Analysis
Analyze blockchain data, wallet activity, transaction flows, and network health
Price Action
Pure price movement study focusing on supply-demand zones and market structure
Trading vs Investing Approach
For Long-term Investing (HODL): Focus on fundamental analysis - evaluate project technology, tokenomics, team credentials, real-world adoption, and competitive advantages. Time horizon: 6 months to several years.
For Active Trading: Combine technical analysis, price action, and on-chain metrics for entries/exits. Monitor Bitcoin dominance, market sentiment, and whale movements for short-term opportunities (hours to weeks).
Example
Before investing in Ethereum, analyze its price charts and key levels (technical), evaluate upcoming upgrades like Dencun and layer-2 scaling (fundamental), check daily active addresses and gas fees (on-chain), and observe staking participation rates to make an informed decision.
2. Technical Analysis for Crypto
Purpose of Technical Analysis Tools
- Identify market trends and momentum in 24/7 crypto markets
- Find optimal entry and exit points for trades
- Determine support/resistance levels for risk management
- Assess overbought/oversold conditions in volatile markets
- Combine multiple indicators to reduce false signals
- Adapt to crypto's unique volatility and liquidity patterns
Drawing Tools
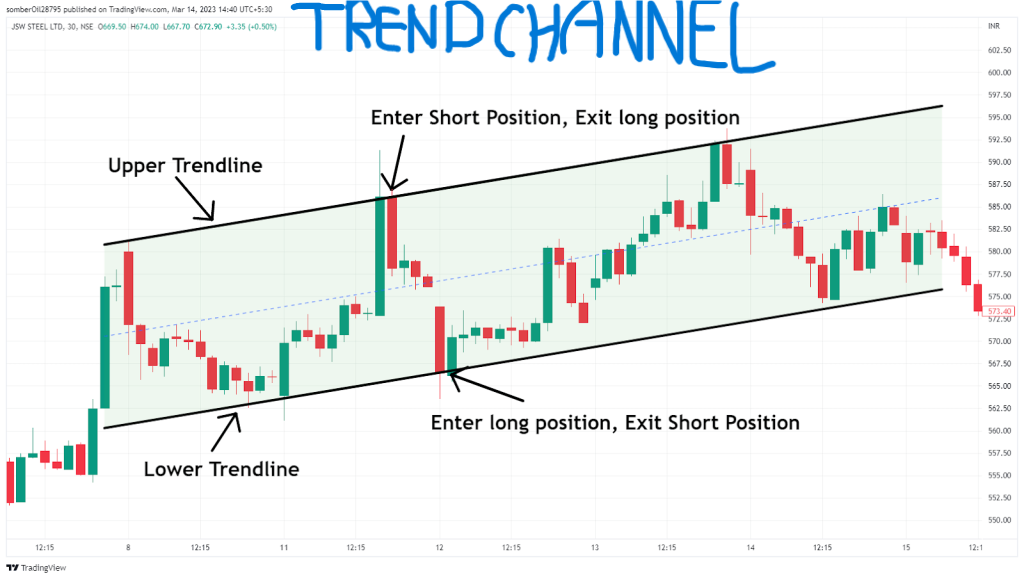
- • Trendline: Connect swing highs/lows to identify trend direction. Break of trendline signals potential reversal
- • Trend Channel: Parallel lines containing price movement, useful for range trading strategies
- • Support & Resistance: Key price zones where buying/selling pressure causes reversals or consolidation
Used to find areas of value to trade from and set price targets
Crypto-Specific Chart Patterns
Crypto markets have unique characteristics that affect pattern formation - 24/7 trading, higher volatility, and strong Bitcoin correlation. These patterns help identify potential reversals or continuations.
Bullish Patterns
- • Double Bottom: W-shaped reversal pattern
- • Ascending Triangle: Higher lows, flat resistance
- • Cup and Handle: Rounded bottom with consolidation
- • Bull Flag: Brief consolidation in uptrend
- • Inverse Head & Shoulders: Strong reversal signal
Bearish Patterns
- • Double Top: M-shaped reversal pattern
- • Descending Triangle: Lower highs, flat support
- • Head and Shoulders: Classic top formation
- • Bear Flag: Brief consolidation in downtrend
- • Rising Wedge: Narrowing range before drop
Patterns are less reliable in illiquid altcoins. Always confirm with volume and wait for breakout confirmation before entering trades.
Key Technical Indicators for Crypto
Mathematical formulas applied to price data to identify trends, momentum, and potential reversals
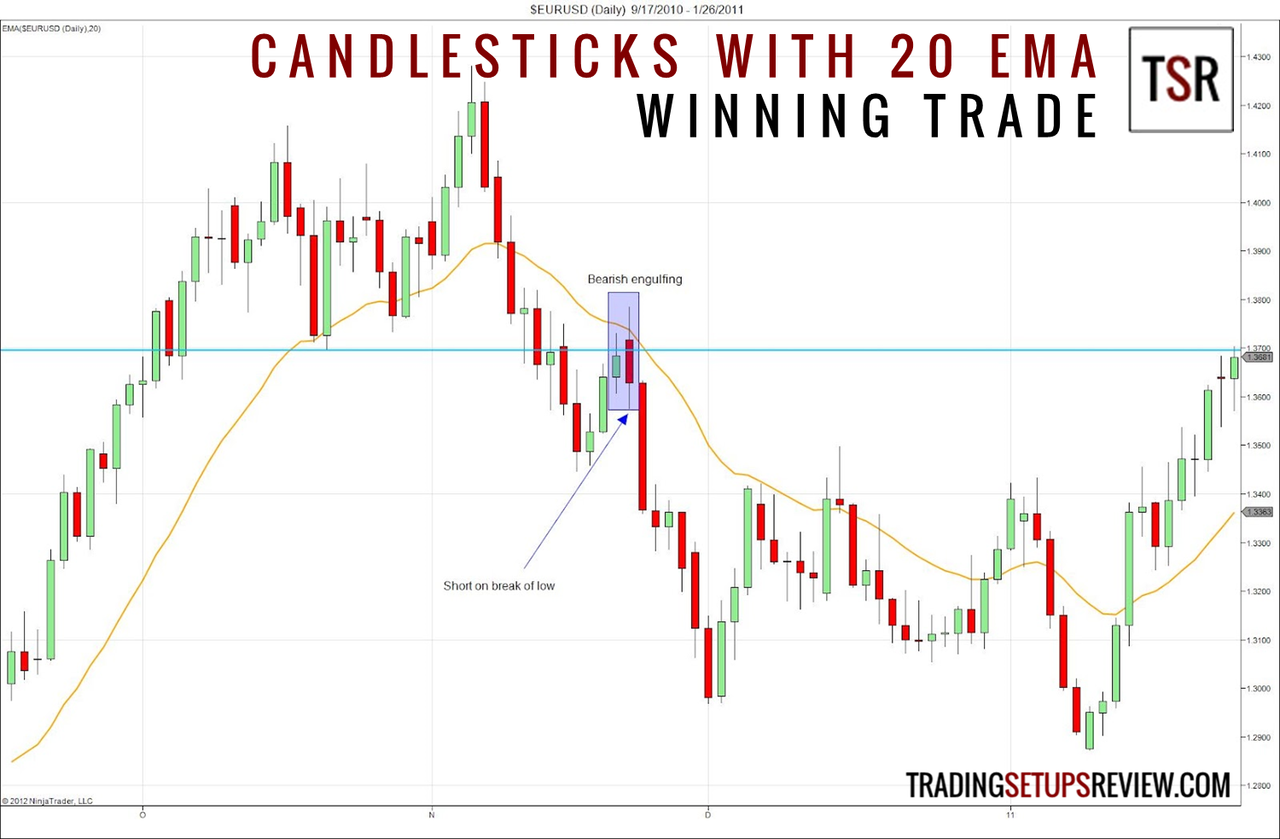
Moving Averages (MA/EMA)
EMA 20, 50, 200 show trend direction. Bitcoin traders watch 200-day MA closely as major support/resistance
RSI (Relative Strength Index)
Overbought (greater than 70) or oversold (less than 30). In crypto bull runs, RSI can stay overbought for extended periods
MACD (Moving Average Convergence Divergence)
Identifies momentum shifts and trend changes. Bullish/bearish crossovers signal potential entries
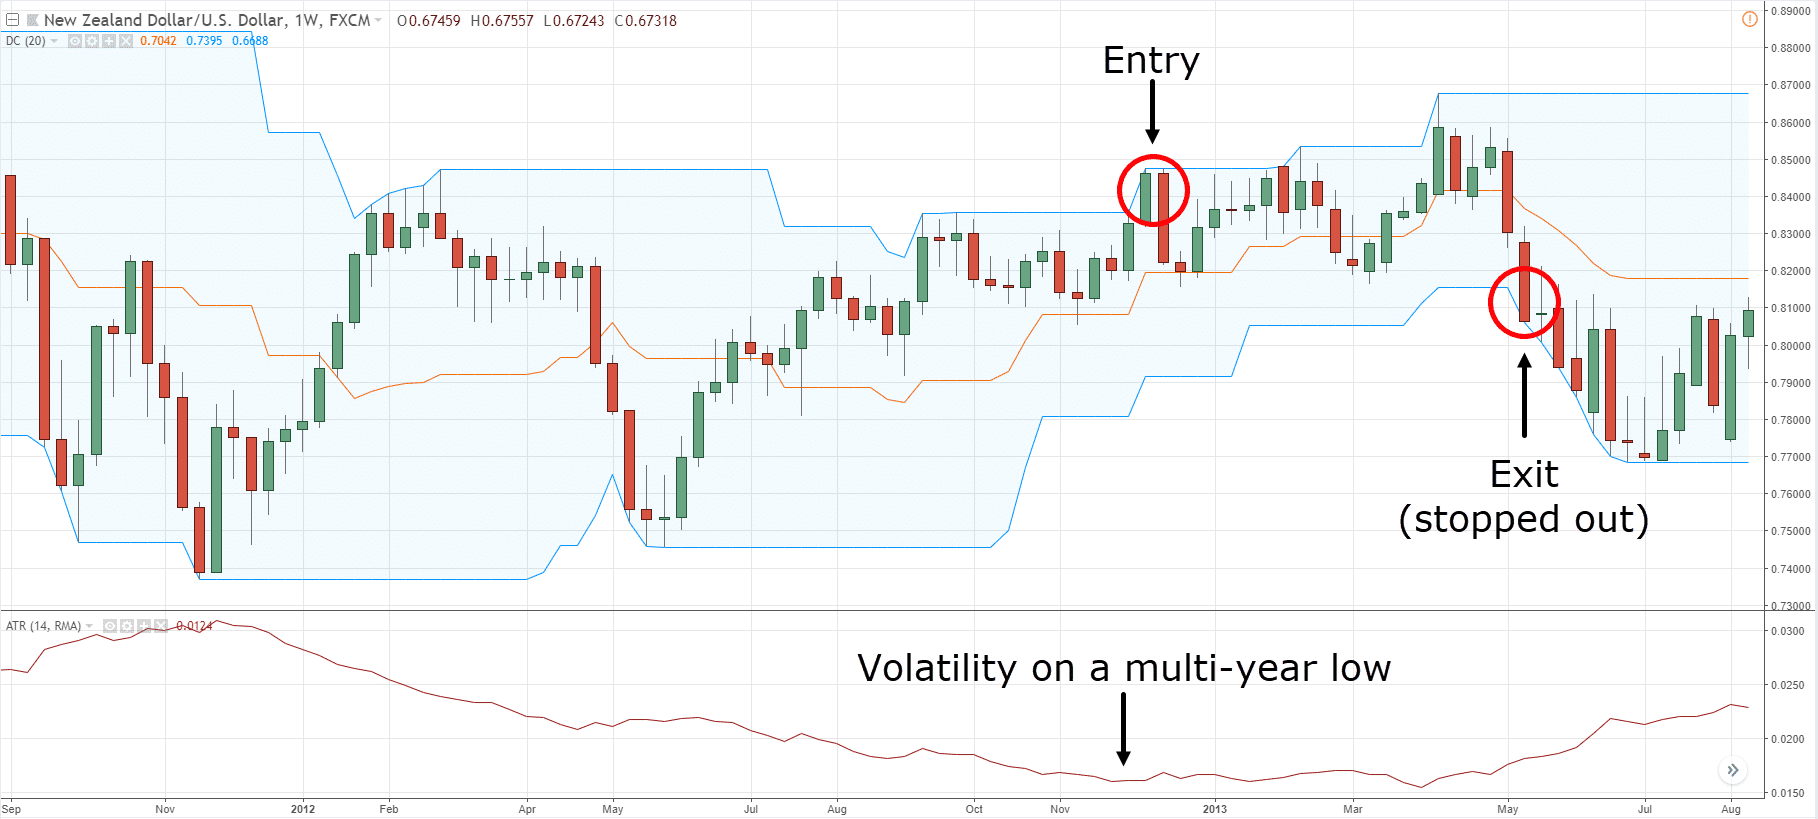
ATR (Average True Range)
Measures volatility - crucial for crypto's wild swings. Use for stop-loss placement (1.5-2x ATR)
Bollinger Bands
Volatility bands around price. Squeeze patterns often precede explosive crypto moves
Volume Profile/VWAP
Shows price levels with highest trading activity. High-volume nodes act as strong support/resistance
Fibonacci Retracements
Key levels: 38.2%, 50%, 61.8%. Crypto respects Fib levels surprisingly well during corrections
Stochastic Oscillator
Momentum indicator comparing closing price to price range. Good for identifying reversals in ranging markets
Don't overload your chart with too many indicators. Use 2-3 complementary indicators that measure different aspects (trend + momentum + volume).
Practical Indicator Combinations for Crypto
1. EMA Crossover + Volume
Golden Cross (50 EMA crosses above 200 EMA) with increasing volume = strong bullish signal. Death Cross = bearish. Bitcoin respects these crosses historically.
2. RSI Divergence + Support/Resistance
Bullish divergence (price makes lower low, RSI makes higher low) at key support = high-probability reversal. Works exceptionally well in crypto.
3. Bollinger Bands + RSI
Bollinger Band squeeze (low volatility) + RSI neutral (40-60) = prepare for explosive move. Monitor volume for breakout direction.
4. MACD + Volume Profile
MACD bullish crossover at high-volume support zone = strong entry signal. Combine with Bitcoin correlation for altcoins.
Ex → Volatility-based Strategy
Ex → Trend + Price Action
Ex → S/R + Reversal Patterns
Advanced Technical Concepts
Volume Analysis
Shows transaction strength and market conviction:
- • High Volume: Confirms strong trends or breakouts - institutional participation
- • Low Volume: Weak trends or potential reversals - retail-only moves
- • Volume Spikes: Signal unusual activity before major moves - often precedes breakouts
- • Volume Divergence: Price rises on declining volume = weak rally, likely to fail
RSI Divergence
Price and indicator moving in opposite directions signal trend exhaustion:
- • Bullish: Price makes lower lows, RSI makes higher lows (upward reversal likely)
- • Bearish: Price makes higher highs, RSI makes lower highs (downward reversal likely)
- • Hidden Divergence: Confirms trend continuation rather than reversal
Moving Average Crossovers
- • Golden Cross: Short-term MA crosses above long-term MA (bullish signal, historically reliable for BTC)
- • Death Cross: Short-term MA crosses below long-term MA (bearish signal, often delayed)
- • Use EMA instead of SMA for faster, more responsive signals in volatile crypto markets
Timeframes Analysis
Short-Term (Scalping/Day Trading)
1-min, 5-min, 15-min charts. High risk, requires constant monitoring. Use tight stops and quick exits.
Medium-Term (Swing Trading)
1-hour, 4-hour, daily charts. Hold positions for days to weeks. Best risk-reward balance for most traders.
Long-Term (Position/HODL)
Weekly and monthly charts. Focus on major trends. Combine with fundamental analysis.
Multi-timeframe analysis: Check higher timeframes (HTF) for overall trend, then zoom into lower timeframes (LTF) for precise entries. Never trade against HTF trend.
Breakouts and Fakeouts
Breakouts
- • Confirm with volume spikes (3x average volume minimum)
- • Wait for candle close above resistance/below support
- • Use multiple indicators for confirmation (RSI, MACD)
- • Watch for retests - price often returns to broken level
Fakeouts (Stop Hunts)
- • Very common in crypto due to high speculation and leverage
- • Whales deliberately trigger stop-losses to fill orders
- • Use wider stops or wait for confirmation candles
- • Low volume breakouts are usually fakeouts
Market Sentiment Indicators (Crypto-Specific)
Fear and Greed Index
Scale: 0-100 measuring crypto market emotions
- • 0-25: Extreme Fear - Potential buying opportunity
- • 26-50: Fear - Market uncertainty
- • 51-75: Greed - Bullish sentiment
- • 76-100: Extreme Greed - Potential top, be cautious
Funding Rates (Futures Markets)
Fees paid between long/short traders:
- • Positive rates (0.01%+): Longs pay shorts, market bullish but overheated
- • Negative rates (-0.01%+): Shorts pay longs, bearish sentiment, potential bounce
- • Extreme rates (greater than 0.1%): Warning of liquidation cascade risk
Bitcoin Dominance
BTC's market cap percentage of total crypto market. Rising dominance = money flows to BTC (flight to safety). Falling dominance = altcoin season begins.
Crypto-Specific Technical Factors
- 24/7 Global Market: No closing bell means gaps don't exist like stocks. Weekend pumps/dumps are common. Price action never sleeps.
- Extreme Volatility: 10-30% daily swings are normal. Wider stop-losses needed (2-3x ATR). Position sizing is crucial - never risk more than 2-3% per trade.
- Liquidity Variations: Bitcoin/Ethereum very liquid. Small-cap altcoins have thin order books causing slippage and manipulation (wick hunting).
- Bitcoin Correlation: 70-90% of altcoins move with Bitcoin. Always check BTC charts first. When BTC dumps, alts dump harder.
- Whale Manipulation: Large holders (whales) can move markets. Watch for wash trading, spoofing, and coordinated dumps/pumps on low-liquidity pairs.
- Exchange Differences: Same coin can have 1-5% price differences across exchanges. Arbitrage opportunities exist but factor in withdrawal fees/times.
- News Impact: Crypto is extremely news-sensitive. Regulatory announcements, exchange hacks, or celebrity tweets can cause 20%+ moves instantly.
Risk Management in Crypto Trading
- Stop-Loss Orders: Always use stops. Place 2-3x ATR below entry for long positions. Use limit orders to avoid exchange failures during volatility.
- Position Sizing: Never risk more than 1-3% of total capital per trade. Use smaller positions (0.5-1%) for high-volatility altcoins.
- Risk-Reward Ratio: Aim for minimum 1:2 ratio. For 1:3, you only need 33% win rate to be profitable. Calculate before entering every trade.
- Trailing Stops: Lock in profits as price moves favorably. Move stop to breakeven after 1:1 profit. Trail 50% below recent swing high.
- Diversification: Don't put all capital in one coin. Spread across 5-10 positions maximum. Avoid overexposure to correlated assets.
- Leverage Caution: Start with spot trading. If using leverage, never exceed 3-5x. Most retail traders lose money with high leverage.
3. Price Action Analysis - The Pure Approach
What is Price Action?
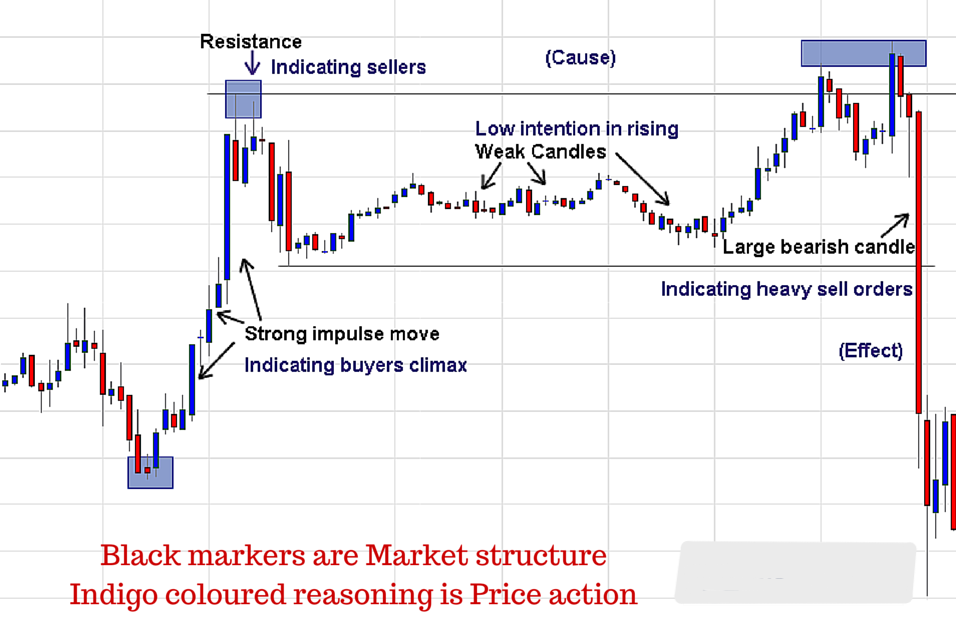
Price action is the study of raw price movement and market structure without relying on lagging indicators. It focuses on reading supply-demand dynamics, support-resistance zones, and candlestick patterns to predict future movements. In crypto's volatile markets, price action provides real-time insights that indicators cannot match.
Price action shows what the market is doing RIGHT NOW. Indicators show what happened in the past.
Technical Analysis vs Price Action
Technical Analysis Limitations
- • Indicators lag behind price (showing past data)
- • Create visual noise and complexity on charts
- • Can give conflicting signals simultaneously
- • Too many indicators cause analysis paralysis
- • Less effective in choppy, sideways markets
Price Action Advantages
- • Clean, uncluttered charts for better clarity
- • Real-time market reading and instant signals
- • More precise entries and exits
- • Works in all market conditions
- • No conflicting signals from indicators
Example - Overcrowded Chart with Too Many Indicators
Price Action Strategy Components
Combination of: Candlestick Patterns + Support & Resistance Zones + Volume Confirmation + Market Structure
Supply & Demand - Foundation of Price Action
- • Demand ↑ (Buyers dominate) = Price ↑
- • Supply ↑ (Sellers dominate) = Price ↓
- • Find imbalance zones for high-probability entries
- • Look for areas where price moved quickly (strong demand/supply)
Support & Resistance Zones
Never just a line - always a zone/area. Price rarely reverses at exact levels. Use zones (2-3% range) for more accurate entries and stops.
Key Price Action Strategies
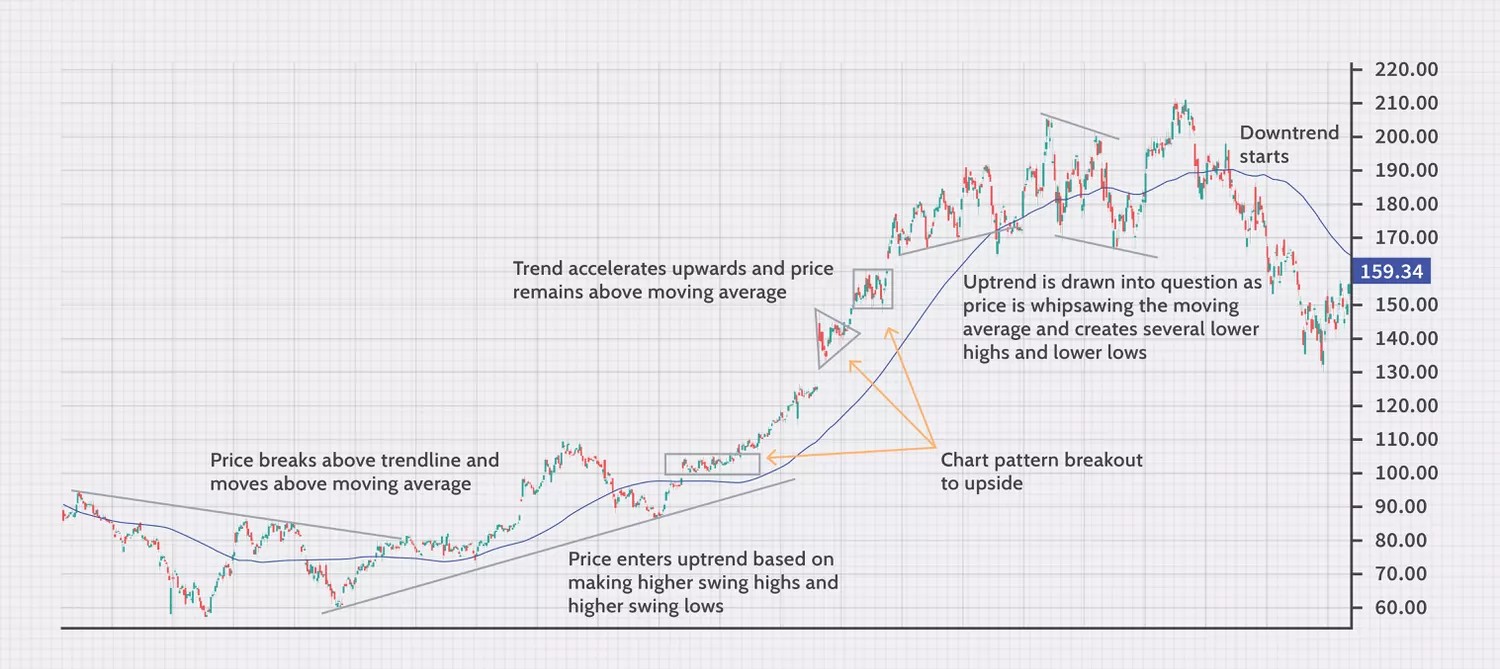
1. Trend Trading (Riding the Wave)
Trade with the dominant trend direction. In uptrends, look for pullbacks to support for long entries. In downtrends, wait for bounces to resistance for short entries. Never fight the trend - "the trend is your friend until the end."
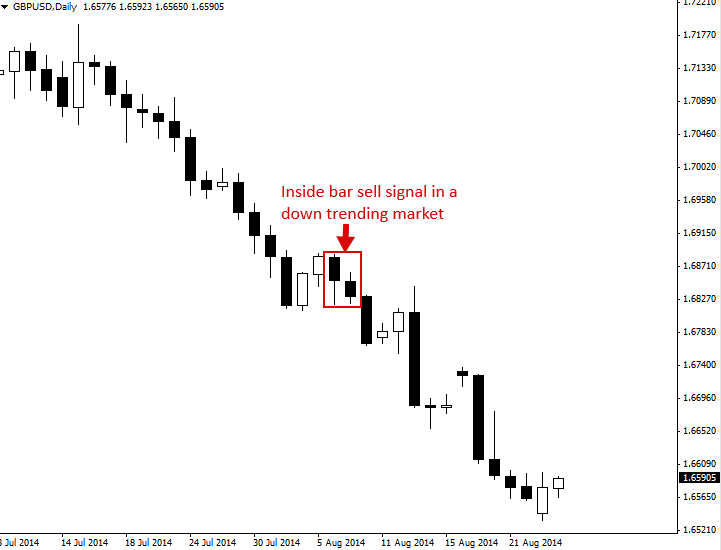
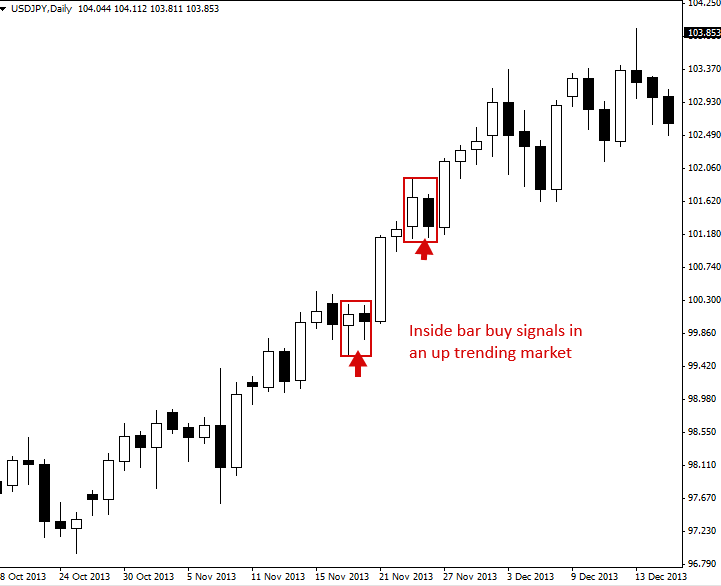
2. Inside Bar Strategy
Inside bar = current candle's high and low are within previous candle's range. Shows consolidation and potential breakout.
Entry: Place buy stop above mother bar's high (bullish) or sell stop below mother bar's low (bearish). Works best with trend or at key levels.
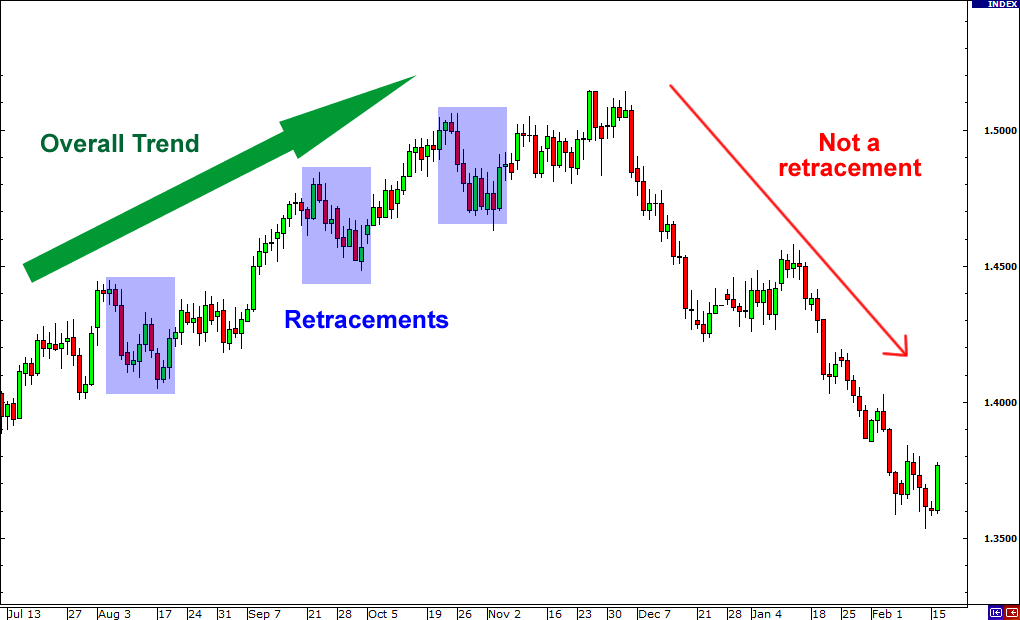
3. Retracements (Pullback Trading)
Temporary price corrections within a larger trend. NOT trend reversals - just profit-taking or consolidation. Wait for retracement to key support (in uptrend) or resistance (in downtrend), then enter with the main trend. Use Fibonacci 38.2%, 50%, or 61.8% levels.
4. Reversals (Trend Changes)
Complete trend direction change. Harder to trade than trends. Look for: higher highs stopping in uptrend, lower lows stopping in downtrend, break of trendline, and volume divergence. Wait for confirmation before entering - don't try to catch falling knives.

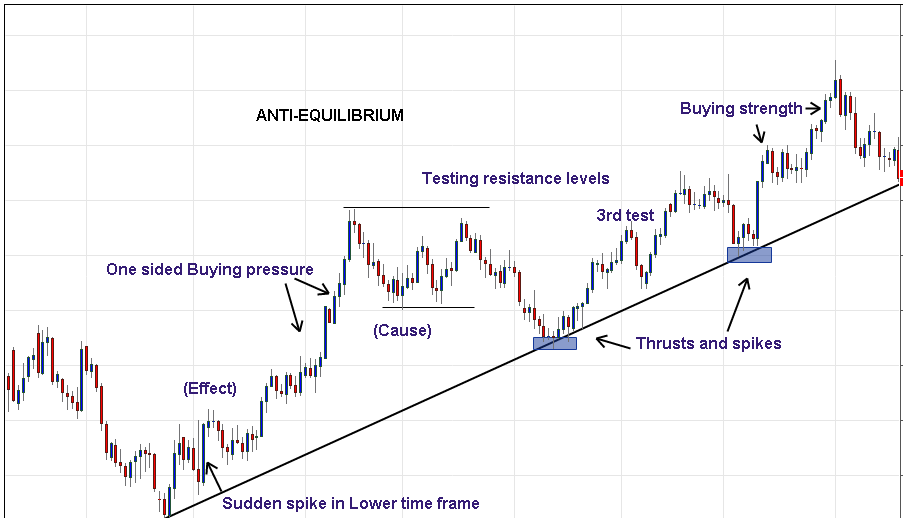
5. Breakouts & Breakdowns
Breakout: Price moves above resistance with strong volume and momentum. Signals new uptrend starting. Often occurs after consolidation patterns (triangles, flags, rectangles).
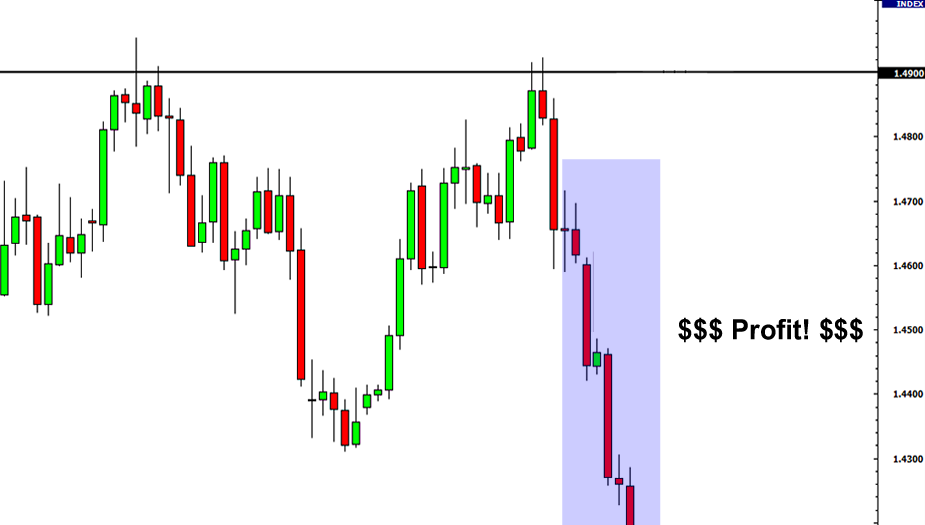
Breakdown: Price falls below support with increasing volume. Signals new downtrend. In crypto, breakdowns tend to be faster and more violent than breakouts.

Breakout - Volume Confirmation Critical
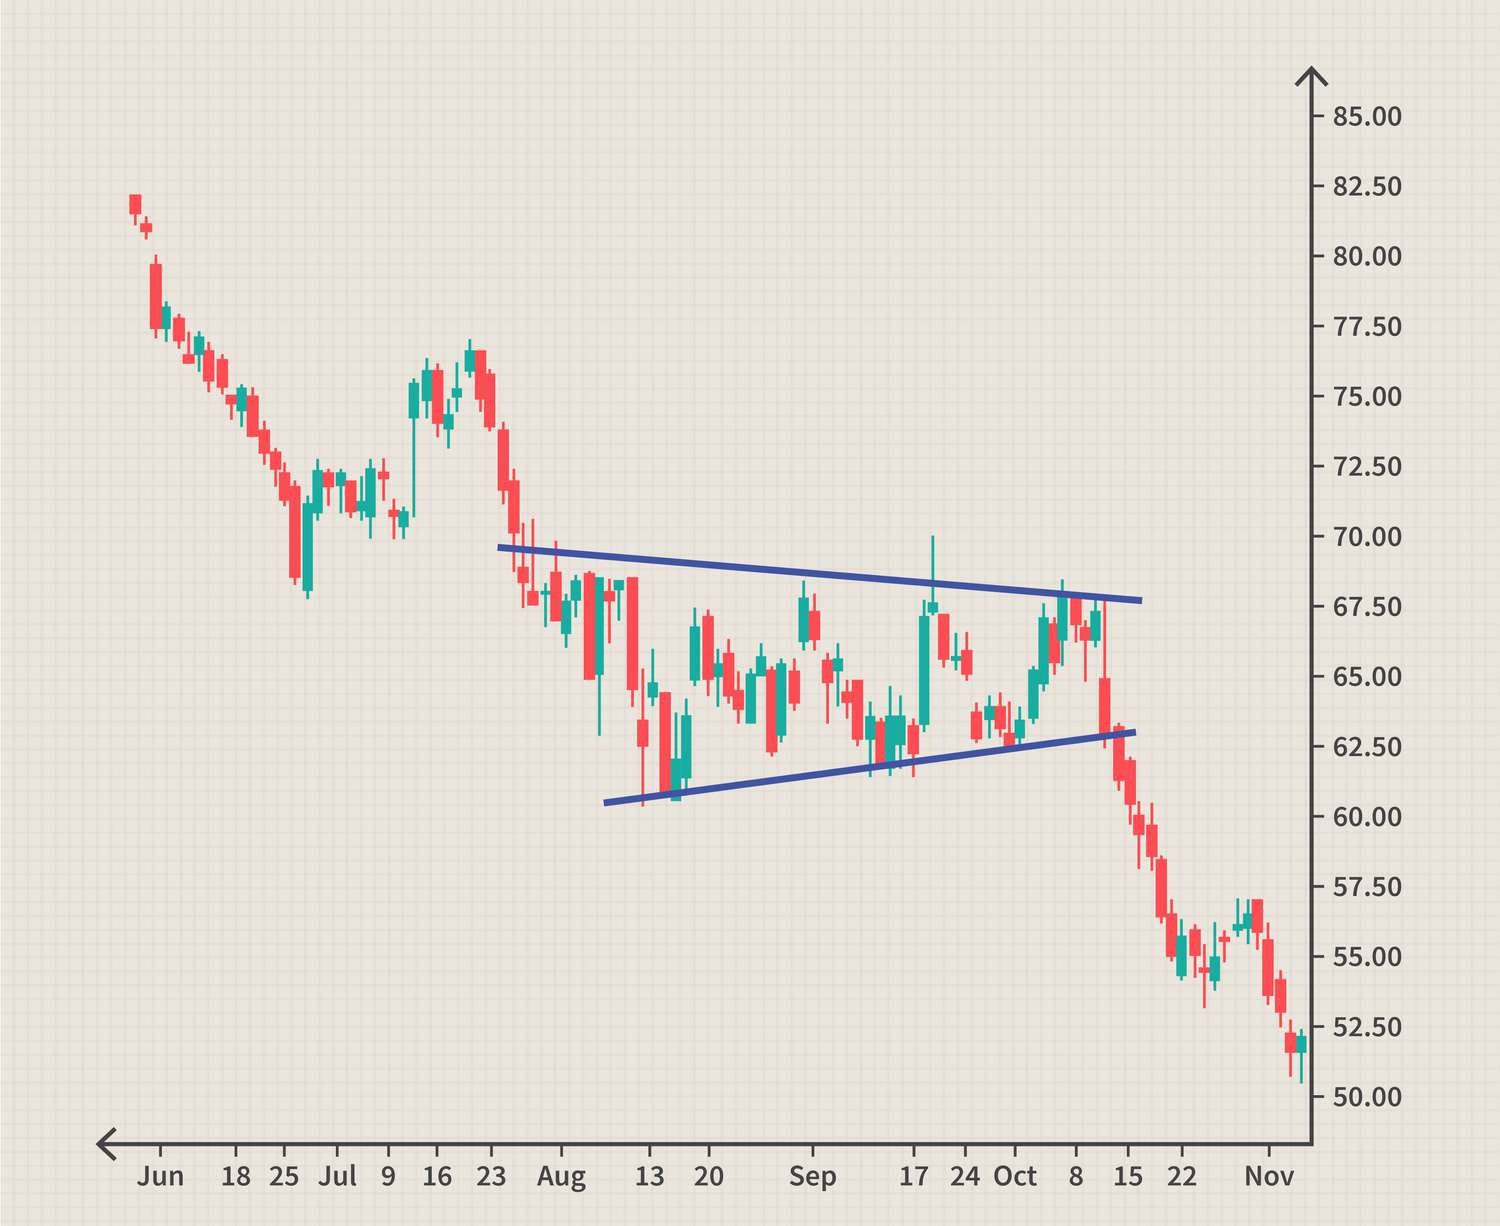
Breakdown - Fast & Violent in Crypto
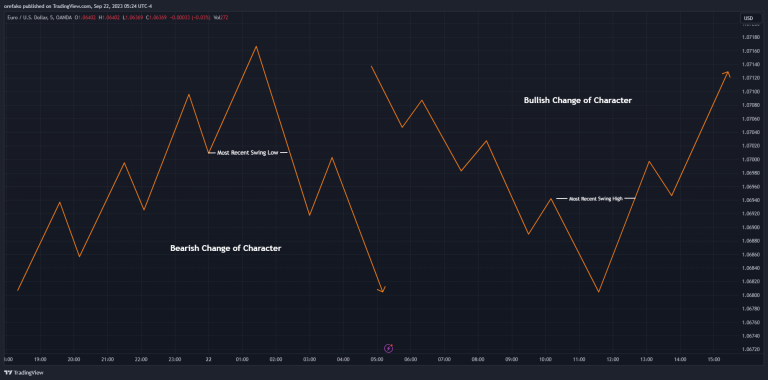
6. Change of Character (ChoCh)
Significant shift in market behavior signaling trend exhaustion. Indicators: break of established trendline, volume spike without price follow-through, sudden volatility increase, or failure to make new highs/lows. In crypto, ChoCh often happens before major reversals - early warning system.
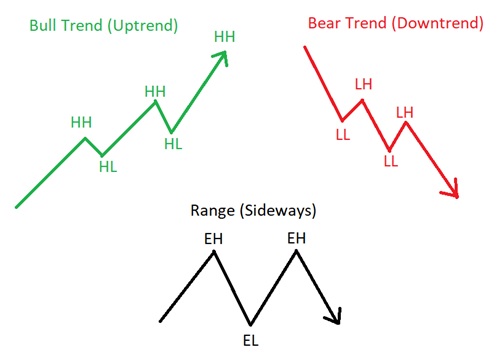
7. Market Structure (Higher Highs/Lower Lows)
The backbone of price action trading. Identify swing points to determine trend:
- • Uptrend: Series of higher highs (HH) and higher lows (HL)
- • Downtrend: Series of lower lows (LL) and lower highs (LH)
- • Sideways: Equal highs and lows - range-bound market
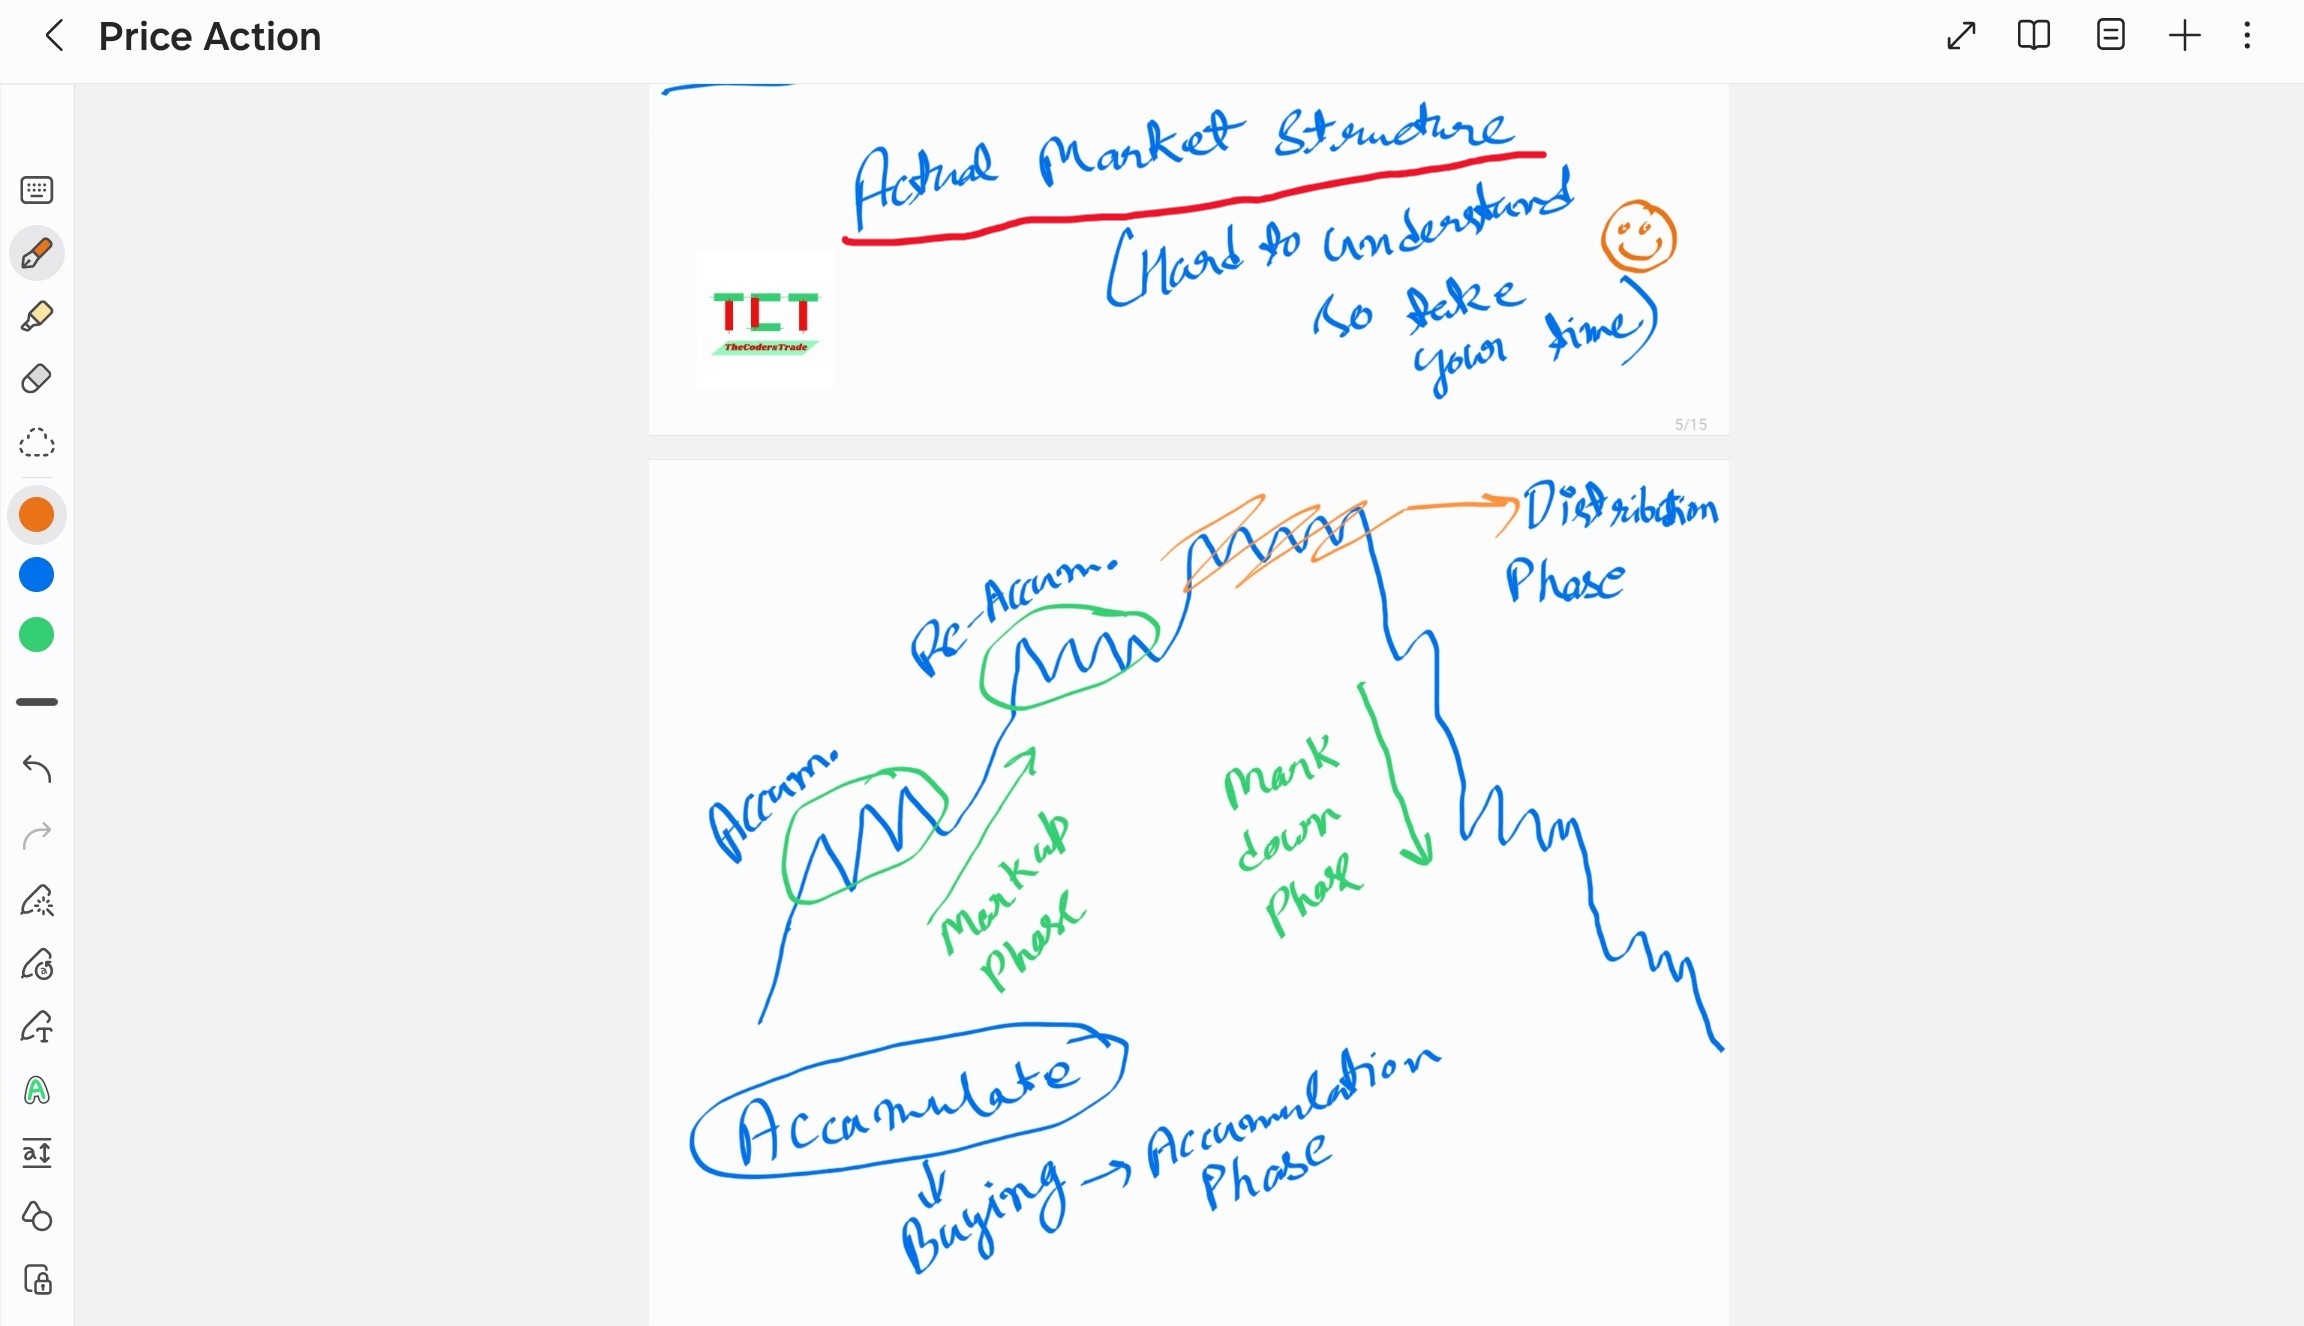
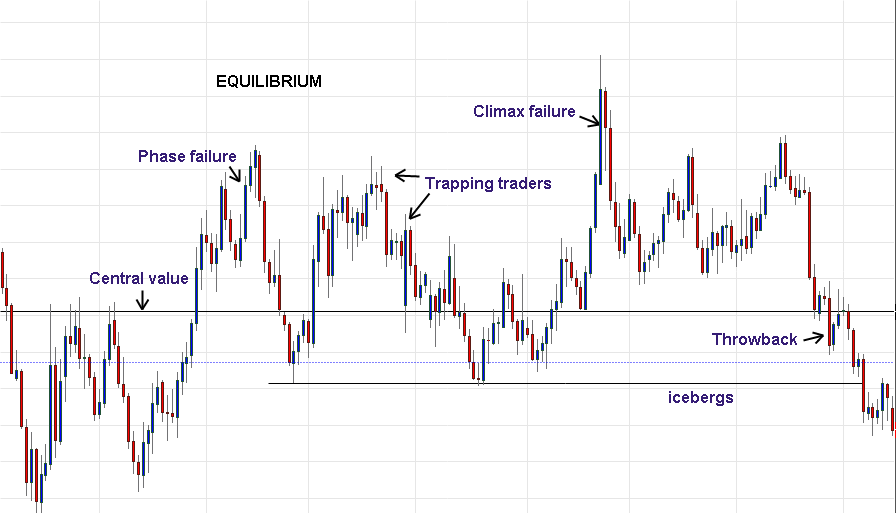
8. Market Structure Phases (Wyckoff Method)
Accumulation → Markup (Bull Phase)
Smart money accumulates at bottom. Markup phase shows strong uptrend. Pullbacks offer entry opportunities (throwbacks). Look for increasing volume on rallies.
Distribution → Markdown (Bear Phase)
Smart money distributes at top. Markdown phase shows strong downtrend. Bounces are selling opportunities. Volume spikes on declines confirm distribution.
Real Chart Examples of Market Structures:
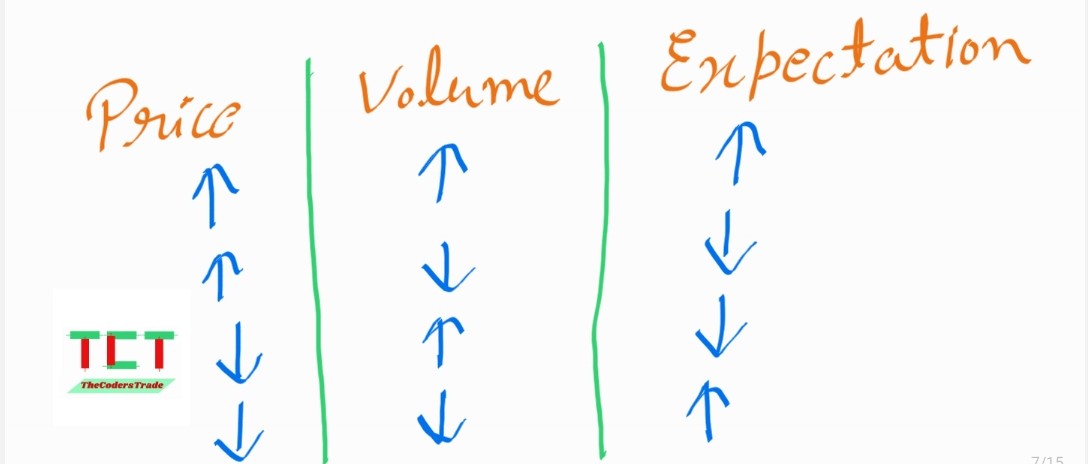
Volume in Price Action (Critical Confirmation)
Volume measures market participation and conviction. Essential for confirming price moves and avoiding false breakouts.
Price-Volume Relationship:
- • Rising Price + Rising Volume: Strong uptrend, institutional buying, sustainable move
- • Rising Price + Falling Volume: Weak uptrend, retail-only, potential reversal soon
- • Falling Price + Rising Volume: Strong downtrend, panic selling, more downside likely
- • Falling Price + Falling Volume: Weak downtrend, selling exhaustion, reversal possible
Candlestick Patterns for Crypto
Single candle or multi-candle formations that signal potential reversals or continuations. Work best at key support/resistance levels.
Bullish Patterns
- • Hammer/Bullish Pin Bar: Long lower wick, rejection of lows
- • Bullish Engulfing: Green candle engulfs previous red candle
- • Morning Star: Three-candle bottom reversal pattern
- • Dragonfly Doji: All-day selling rejected, close near high
Bearish Patterns
- • Shooting Star/Bearish Pin Bar: Long upper wick, rejection of highs
- • Bearish Engulfing: Red candle engulfs previous green candle
- • Evening Star: Three-candle top reversal pattern
- • Gravestone Doji: All-day buying rejected, close near low
4. Fundamental Analysis for Crypto
1. Whitepaper Analysis (Project Blueprint)
The foundational document outlining the cryptocurrency's purpose, technology, and vision. First step in evaluating any crypto investment.
Key Areas to Evaluate:
- Problem Statement: Does it solve a real-world problem or just speculation?
- Technical Innovation: Unique technology or copycat project?
- Roadmap Clarity: Specific milestones with realistic timelines?
- Token Utility: Essential for ecosystem or forced/artificial use case?
- Competitive Analysis: How does it compare to competitors?
Red Flags: Vague technical details, unrealistic promises, no clear use case, copied whitepaper, anonymous team with no track record.
Good Signs: Detailed technical specifications, realistic goals, clear token utility, experienced team, active development.
2. Tokenomics (The Economics of Tokens)
Arguably the most important fundamental factor. Poor tokenomics can destroy even the best projects through inflation or lack of demand.
Supply Metrics
- • Max Supply: Fixed cap (Bitcoin 21M) vs unlimited (Ethereum)
- • Circulating Supply: Currently available in market
- • Inflation Rate: New tokens created per year (lower = better)
- • Unlock Schedule: When will locked tokens enter market?
Distribution & Vesting
- • Team Allocation: Less than 20% is healthy
- • Public Sale: Higher % = more decentralized
- • Vesting Period: Minimum 1-2 years for team/advisors
- • Community Fund: For ecosystem growth
Utility & Demand Drivers
- • Governance: Voting rights for protocol changes
- • Staking Rewards: Incentive to hold long-term
- • Fee Payments: Required for network transactions
- • Burn Mechanisms: Deflationary pressure (reduces supply)
Warning: Watch for massive token unlocks. Check vesting schedules on sites like Token Unlocks. Large unlocks can crash price 30-50% as insiders dump.
3. Team & Development (Trust Factor)
In crypto, the team makes or breaks the project. Anonymous teams are red flags unless there's exceptional reason (like early Bitcoin).
Team Assessment
- Founders' track record - previous successful projects?
- Technical expertise - developers with blockchain experience?
- LinkedIn/GitHub profiles - real people with verifiable history?
- Communication - active on social media, transparent updates?
- Advisory board - reputable advisors from crypto industry?
- Backing - VC funding from known crypto investors?
Development Activity
- GitHub commits - regular code updates (daily/weekly)?
- Active contributors - multiple developers, not just one?
- Code quality - professional, well-documented?
- Security audits - by reputable firms (CertiK, Trail of Bits)?
- Milestone delivery - actually shipping what's promised?
- Open-source - transparent code or closed/hidden?
4. Technology & Use Case (The Why)
Does the world actually need this crypto? Many projects are solutions looking for problems.
- Real Problem Solved: Does it address actual pain points or just buzzwords?
- Technology Innovation: Novel approach or slight modification of existing tech?
- Scalability: Can it handle mass adoption? (Transactions per second, fees under load)
- Security: Consensus mechanism tested? Previous hacks or exploits?
- Interoperability: Works with other blockchains or isolated ecosystem?
- Decentralization: Truly decentralized or just a centralized database?
5. Adoption Metrics (Proof of Concept)
Real usage is the ultimate validation. Many projects have great whitepapers but zero adoption.
Active Users & Wallets
Daily/monthly active addresses growing? Ethereum has millions, small projects should show growth trajectory.
Transaction Volume
Daily transactions and transaction value. Increasing = real utility. Check on-chain explorers like Etherscan.
Ecosystem Development
dApps building on platform? Business partnerships? Integration with major players? Example: Ethereum's DeFi and NFT ecosystems.
Total Value Locked (TVL)
For DeFi projects, TVL shows how much capital trusts the protocol. Track on DeFiLlama.
6. Community and Social Sentiment
Strong, organic community drives adoption. Distinguish between paid shillers and genuine believers.
Social Media Presence
- • Twitter: Engaged followers, not bot accounts
- • Reddit/Discord: Active discussions, helpful community
- • Telegram: Official announcements, not just price speculation
- • Response Rate: Team actively answers questions?
Community Quality
- • Organic growth vs paid promotions/giveaways
- • Technical discussions vs "wen moon" talk
- • Developer community - people building with it?
- • Sentiment analysis - LunarCrush, Santiment tools
7. Market Position & Competition
- Market Cap Ranking: Top 100? Top 500? Higher rank = more established but less growth potential
- Competitive Advantage: Competitive advantage? Does it better/cheaper/faster than alternatives?
- Direct Competitors: Compare similar projects (Solana vs Ethereum, Uniswap vs PancakeSwap)
- Strategic Partnerships: Integrations with major companies (Visa, Microsoft, etc.) add credibility
- Exchange Listings: Listed on major exchanges (Binance, Coinbase) = more liquidity and trust
- First-Mover Advantage: Being first in category helps but not guaranteed (remember MySpace vs Facebook)
8. Regulatory and Legal Landscape
Regulatory Risks
- • Securities Classification: Is it considered a security? SEC scrutiny risk
- • Compliance Status: KYC/AML compliance for institutional adoption
- • Geographic Restrictions: Banned in certain countries?
- • Legal Entity: Registered company or anonymous DAO?
Regulatory Tailwinds
- • Government adoption or blockchain pilots
- • Clear regulatory frameworks (Switzerland, Singapore)
- • Institutional investment approval (ETFs, custody)
- • Central bank digital currency (CBDC) partnerships
9. Macroeconomic Factors
Crypto doesn't exist in vacuum - traditional markets heavily influence prices.
- Interest Rates: Fed rate hikes = risk-off, crypto falls. Rate cuts = risk-on, crypto rallies
- Inflation: High inflation historically benefits Bitcoin (digital gold narrative)
- Dollar Strength: Strong USD usually pressures crypto prices down
- Stock Market Correlation: Crypto increasingly correlated with tech stocks (Nasdaq)
- Institutional Adoption: More hedge funds, corporations, pension funds entering = legitimacy
10. Red Flags to Avoid
- • Anonymous Team: No faces, fake LinkedIn profiles
- • Unrealistic Promises: "10,000x guaranteed" or "next Bitcoin"
- • Excessive Marketing: All promotion, no development
- • Poor Tokenomics: Team owns 50%+, no vesting, huge supply unlocks
- • No Working Product: Years in development, nothing to show
- • Security Issues: Multiple hacks, unaudited code
- • Dead GitHub: No commits in months
- • Centralization: One entity controls majority of tokens/nodes
5. On-chain Analysis (Blockchain Intelligence)
On-chain analysis examines data directly from the blockchain - the ultimate source of truth. Unlike traditional markets where insider info is hidden, blockchain transparency allows us to track wallet movements, exchange flows, and network health in real-time.
Network Activity Metrics
Active Addresses
Daily/monthly unique addresses transacting. Growing addresses = increasing adoption. Bitcoin: 800k-1M daily, Ethereum: 400k-600k daily active addresses.
Transaction Count & Volume
Number of transactions + total value transferred. High volume = real usage. Watch for wash trading (same coins moving back and forth).
Hash Rate (PoW Chains)
Bitcoin/Litecoin mining power. Higher hash rate = more secure network. Rising hash rate = miner confidence in future prices.
Network Fees (Gas Fees)
High fees = high demand for block space. Ethereum gas spikes during NFT mints or DeFi activity. Indicator of network congestion and usage.
Holder Behavior Analysis (Smart Money Tracking)
HODL Waves
Age distribution of coins:
- • Short-term holders (less than 6 months): Weak hands, sell in panic
- • Long-term holders (1+ years): Strong hands, accumulate in bear markets
Exchange Flows
Track coins moving:
- • Into exchanges: Selling pressure, bearish
- • Out of exchanges: Accumulation, bullish (people moving to cold storage)
Whale Activity
Wallets holding 1,000+ BTC or 10,000+ ETH. Track on Whale Alert. Large accumulation = bullish. Large distribution = bearish. Watch for coordinated moves.
Staking & Network Security Metrics (PoS Chains)
Staking Ratio
Percentage of total supply staked. Higher = more tokens locked, less selling pressure. Ethereum: ~25% staked, Solana: ~70% staked. Shows long-term holder confidence.
Validator Count
Number of nodes securing network. More validators = more decentralized and secure. Ethereum: 900k+ validators, shows strong decentralization.
Advanced On-chain Metrics
NVT Ratio (Network Value to Transactions)
Market cap divided by daily transaction volume. Crypto's version of P/E ratio.
- • Low NVT (less than 50): Undervalued, high utility relative to price
- • High NVT (greater than 150): Overvalued, low utility relative to price
MVRV Ratio (Market Value to Realized Value)
Current price vs average acquisition price of all coins. Shows if holders are in profit or loss.
- • MVRV less than 1: Market trading below cost basis, potential bottom
- • MVRV 1-3: Fair value range
- • MVRV greater than 3.5: Overheated, holders in massive profit, potential top
Realized Cap
Values each coin at price it last moved (not current price). More accurate than market cap because it excludes lost coins. Shows "fair value" of network.
Spent Output Profit Ratio (SOPR)
Shows if coins being moved are at profit or loss. SOPR greater than 1 = profit-taking. SOPR less than 1 = capitulation. Reset to 1 = market equilibrium.
Miner & Validator Metrics
Miner Revenue (Bitcoin)
Daily income from block rewards + fees. When miner revenue falls below operating costs, weak miners capitulate (sell Bitcoin), often marking bottoms.
Miner Reserves
Bitcoin held by mining pools. Increasing reserves = miners accumulating (bullish). Decreasing = miners selling to cover costs (bearish).
Where to Access On-chain Data
Free Tools
- • Glassnode Studio: Basic metrics free
- • CryptoQuant: Bitcoin-focused data
- • Etherscan/BscScan: Blockchain explorers
- • Whale Alert: Large transaction tracking
Premium Tools
- • Glassnode Pro: Advanced metrics
- • Santiment: Social + on-chain data
- • IntoTheBlock: AI-powered insights
- • Nansen: Wallet labeling & tracking
What to Monitor Daily
- • Exchange net flows (in/out)
- • Whale transactions
- • Stablecoin supply changes
- • Active addresses trend
6. Sentiment Analysis (Market Psychology)
Crypto markets are heavily driven by emotion and sentiment. Understanding crowd psychology can give you an edge - be greedy when others are fearful, fearful when others are greedy.
Social Media Sentiment
- • Twitter: Track trending crypto hashtags, influencer sentiment
- • Reddit: r/cryptocurrency sentiment, post engagement
- • Google Trends: Search volume for "buy Bitcoin" vs "sell Bitcoin"
- • LunarCrush: Social metrics aggregator
Contrarian Indicators
- • Mainstream media covering crypto = likely near top
- • Everyone in Uber/Starbucks talking about crypto = euphoria phase
- • "Bitcoin is dead" articles = likely near bottom
- • Extreme fear + negative news = buying opportunity
7. Essential Analysis Tools and Platforms
Technical Analysis Platforms
- TradingView: Industry standard, best charting tools, custom indicators, social features
- Coinigy: Multi-exchange trading terminal, portfolio tracking
- CryptoWatch (Kraken): Professional charting, fast execution
- GoCharting: Indian crypto-focused platform with INR pairs
- 3Commas: Automated trading bots, dollar-cost averaging
- TabTrader: Mobile app for trading across exchanges
Fundamental Analysis Resources
- CoinGecko: Comprehensive data, tokenomics, social metrics
- CoinMarketCap: Market data, project info, crypto calendar
- Messari: Professional research reports, governance tracking
- DeFiLlama: DeFi TVL and protocol analytics
- Token Unlocks: Track vesting schedules and token releases
- CryptoRank: ICO/IEO analysis, fundamental metrics
On-chain Analysis Platforms
- Glassnode: Most comprehensive on-chain metrics (paid)
- CryptoQuant: Bitcoin-focused, exchange flows, miner data
- Santiment: Social + on-chain combined analysis
- IntoTheBlock: AI-powered insights, beginner-friendly
- Nansen: Wallet tracking, smart money following
- Dune Analytics: Custom blockchain queries and dashboards
8. Complete Analysis Workflow (Step-by-Step)
1. Check Bitcoin First
BTC dominance, trend, key levels. If Bitcoin is dumping, don't buy alts - 90% will follow down.
2. Market Sentiment Overview
Fear & Greed Index, funding rates, social sentiment. Are we in extreme fear (buy) or extreme greed (caution)?
3. Fundamental Screening
Read whitepaper, check tokenomics, verify team, assess technology. Is this project legitimate or a scam?
4. On-chain Verification
Active addresses growing? Exchange outflows positive? Whales accumulating or distributing?
5. Technical Analysis
Identify trend, key support/resistance, entry zones. Use multi-timeframe analysis (HTF trend, LTF entry).
6. Volume Confirmation
Is volume supporting the move? Low volume breakouts usually fail. High volume = conviction.
7. Risk-Reward Calculation
Entry price, stop-loss, take-profit targets. Minimum 1:2 ratio. Calculate position size (1-3% risk).
8. Set Alerts & Monitor
Price alerts at key levels, volume spikes, whale movements. Don't stare at charts 24/7 - let alerts notify you.
9. Common Analysis Mistakes to Avoid
Confirmation Bias
Only seeking information that supports your existing position. Already bought? You'll find bullish reasons and ignore bearish signals. Force yourself to look for contrary evidence.
Analysis Paralysis
Over-analyzing and never taking action. Too many indicators, too much data. Set clear entry criteria and execute when conditions are met. Perfect is the enemy of good.
Ignoring Bitcoin Correlation
Analyzing altcoins in isolation. When Bitcoin dumps 10%, your altcoin will likely dump 20-30%. Always check BTC first before buying alts.
FOMO-driven Analysis
Rushing analysis because price is pumping. "I'll miss out!" Usually results in buying tops. Opportunities come every day - patience pays.
Neglecting Risk Management
Focusing only on potential gains, ignoring potential losses. "It can 100x!" Yes, or go to zero. Always define your risk first, profit second.
Following Hype Over Data
Making decisions based on Twitter hype or YouTube shills instead of solid analysis. Influencers are often paid promoters or selling bags.
Overtrading Based on Analysis
Just because you can analyze doesn't mean you should trade. Best traders wait for A+ setups. Quality over quantity - sometimes the best trade is no trade.
Ignoring Timeframe Context
Bullish on 1-hour chart, bearish on daily chart. Which one matters? Always analyze higher timeframes first for overall trend, then zoom into lower timeframes for entries.
10. Building Your Personal Analysis Framework
1. Define Your Investment Strategy
Trader Profile
- Timeframe: Scalping, day trading, swing trading, or long-term?
- Risk tolerance: Conservative (1% risk) or aggressive (3% risk)?
- Capital: Less than $1,000 or greater than $10,000? (affects strategy)
- Time commitment: Full-time or part-time monitoring?
Goal Setting
- Monthly/yearly return target (be realistic: 5-10% monthly is excellent)
- Maximum drawdown tolerance (how much can you lose before stopping?)
- Preferred assets: Bitcoin/Ethereum only or altcoins too?
- Exit strategy: When will you take profits? Move to stablecoins?
2. Create Analysis Checklists
Technical Checklist
- □ Bitcoin trend direction
- □ Higher timeframe trend aligned
- □ Support/resistance identified
- □ Volume confirmation present
- □ RSI/MACD confluence
- □ Risk-reward minimum 1:2
Fundamental Checklist
- □ Team verified and credible
- □ Whitepaper quality assessed
- □ Tokenomics favorable
- □ Active development (GitHub)
- □ Growing adoption metrics
- □ No major red flags
On-chain Checklist
- □ Exchange flows bullish
- □ Whale accumulation detected
- □ Active addresses growing
- □ MVRV ratio in range
- □ No major unlocks coming
- □ Funding rates neutral
3. Develop a Scoring System
Create a 1-10 scoring system for each analysis category. Set minimum thresholds for investment (e.g., total score must be 7+ to enter trade).
4. Combine Multiple Approaches
Most successful crypto investors use a layered approach:
Layer 1 - Fundamental: Identify quality projects with strong fundamentals worth holding 1-3 years
Layer 2 - Technical: Use technical analysis to time entry points within those quality projects
Layer 3 - On-chain: Confirm technical signals with on-chain data (exchange flows, whale activity)
Layer 4 - Risk Management: Position size based on conviction, use stop-losses, take partial profits
5. Keep a Trading Journal
Document every trade to improve over time:
- Entry/exit prices and reasoning
- Technical setup and indicators used
- Fundamental thesis (why this coin?)
- Emotional state when entering (calm or FOMO?)
- Result and lessons learned
- What you'd do differently next time
Pro Tip: Review your journal monthly. You'll spot patterns - which setups work for you, which don't. Double down on what works, eliminate what doesn't.
Conclusion: Mastering Crypto Analysis
Successful crypto analysis is not about using every tool available, but about finding the right combination that works for YOUR trading style and goals. The key is consistency, discipline, and continuous learning.
Key Takeaways:
- Start Simple: Master basic technical analysis and price action before adding complexity
- Always Check Bitcoin First: 90% of altcoins follow BTC - ignore this at your peril
- Combine Approaches: Use fundamental for WHAT to buy, technical for WHEN to buy, on-chain for confirmation
- Risk Management is King: Protect your capital first, profits second. No stop-loss = no trading
- Emotional Control: FOMO and fear are your enemies. Stick to your plan, trade your system
- Be Patient: Not every day is a trading day. Wait for A+ setups that meet all your criteria
- Never Stop Learning: Crypto evolves rapidly. What worked in 2021 may not work in 2025
- Size Matters: 1-3% risk per trade keeps you in the game long-term. Overleveraging = account blown
The 80/20 Rule for Crypto Analysis
80% of your results will come from 20% of your efforts. Focus on:
- • Bitcoin trend (if BTC down, everything down)
- • Key support/resistance levels
- • Volume confirmation
- • Risk management and position sizing
- • Emotional discipline and patience
Final Words of Wisdom
Analysis improves your odds, but crypto markets are inherently unpredictable. Even the best analysis can be wrong. That's why risk management isn't optional - it's essential for survival.
Start small, learn from mistakes, keep a journal, and never risk money you can't afford to lose. The goal isn't to get rich quick - it's to stay in the game long enough to compound your gains over years.