Stock Market Learning Index
Complete guide to master stock market trading with color-differentiated, structured modules.
Foundation & Technical Analysis
8 ModulesStock Market Basics
What is stock market and how it works?
Market Terms
All important market terminology
Trade Types
Intraday, delivery, BTST & swing
Trading Styles
Scalping, momentum, position trading
Candlestick Patterns
Bullish, Bearish & Continuation patterns
Chart Patterns
Technical chart patterns and breakouts
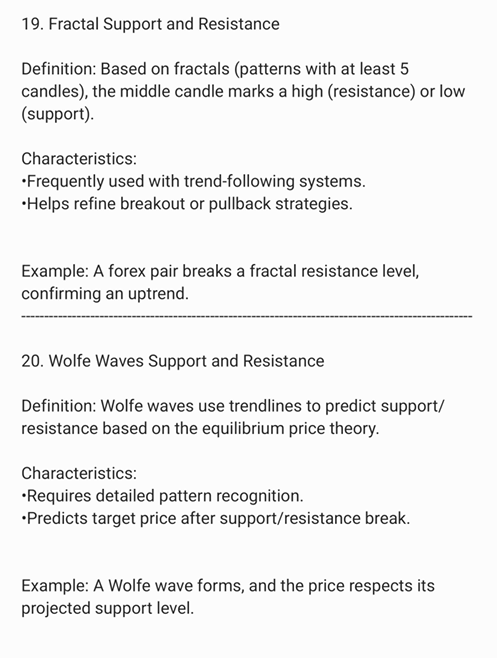
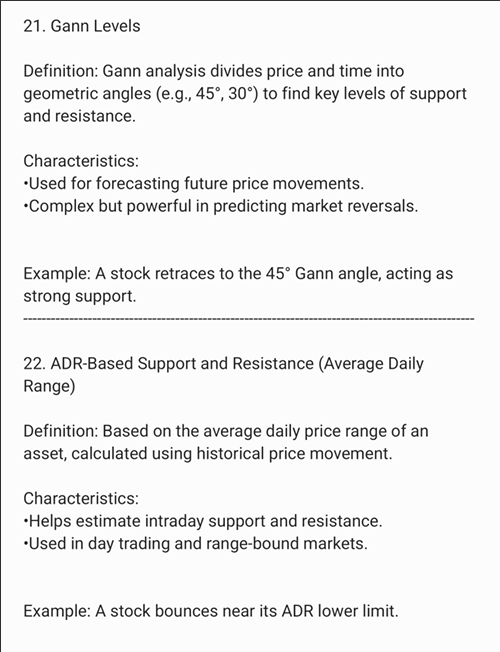
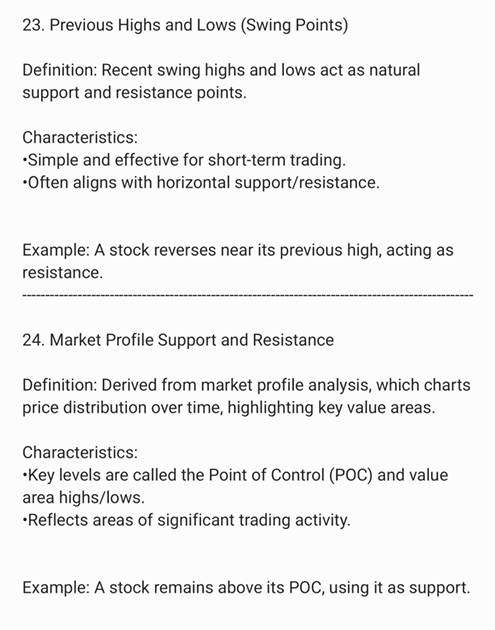
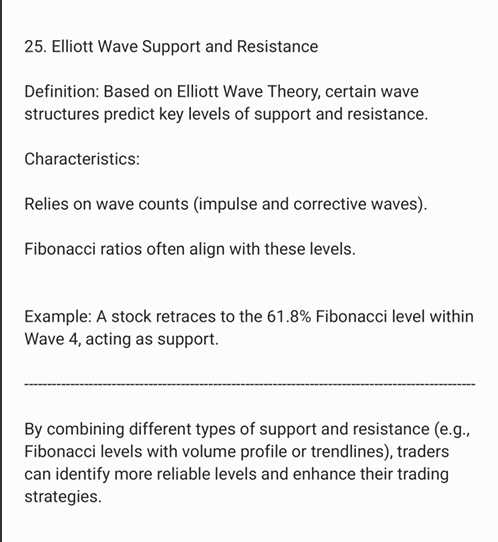
Support & Resistance
Key price levels & supply-demand zones
Market Analysis
Technical, Fundamental & Price Action
Advanced Concepts & Derivatives (F&O)
6 ModulesFutures & Options
Derivatives ecosystem & F&O overview
Futures Trading
Margin, lot size, expiry & contracts
Options Trading
Calls, Puts & option payoff strategies
Options Buying
Call & Put buying, Greeks, time decay
Options Selling
Premium collection & writing strategies
Smart Money Concept
Order blocks, liquidity pools & fair value
All About Support and Resistance
Master the structural framework of institutional order flow. Identify where market demand creates floors and where supply creates ceilings across all asset classes with verified visual chart models.
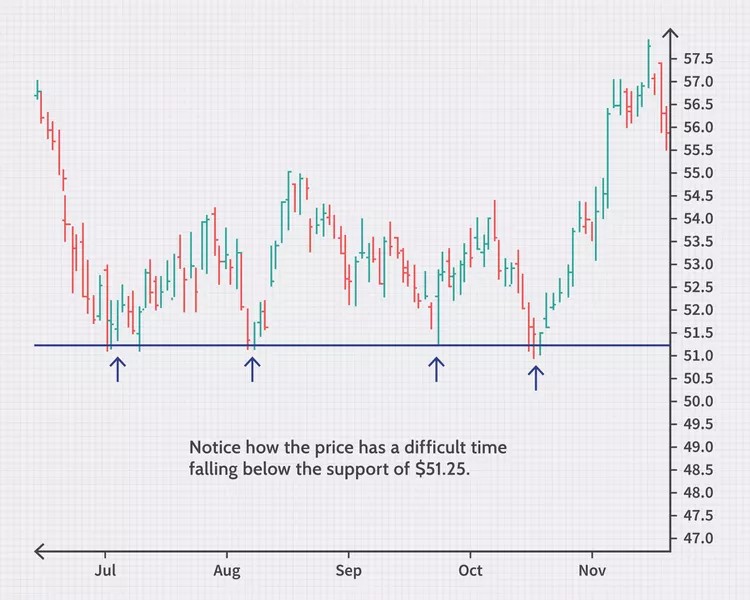
Support Zone
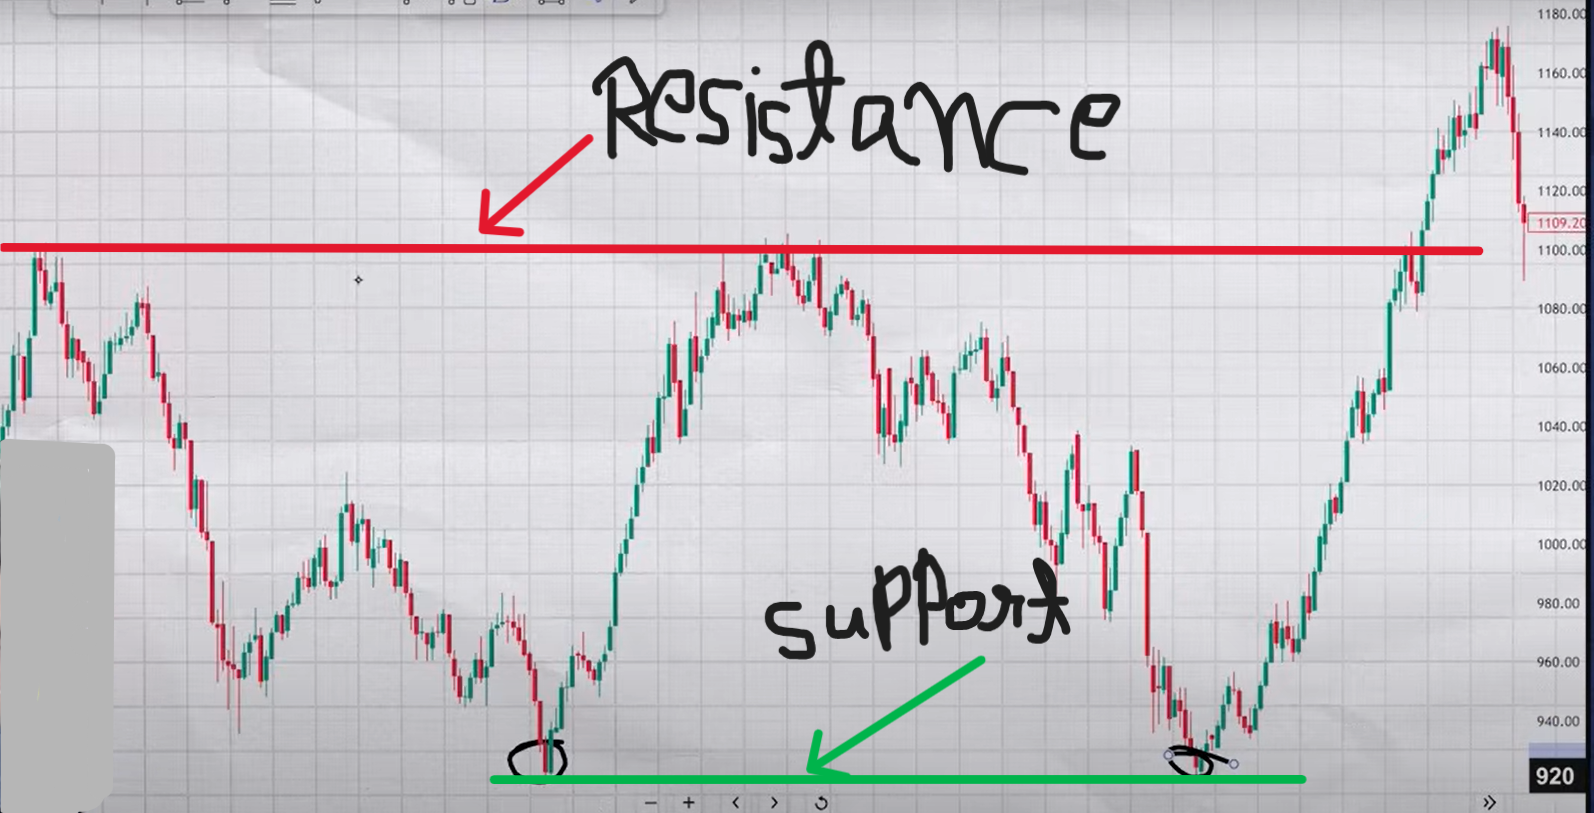
A price level where an asset tends to stop falling and bounce upwards. Institutional buying orders cluster here, absorbing sell volume and reversing downtrends.
- Acts as a barrier/floor preventing lower tick prices
- Formed at historical swing lows and key round psychological numbers
- Traders use support tests to enter long trades with tight stops beneath the floor
Resistance Zone
A price level where an asset tends to halt rising and reverse downwards. Institutional selling orders overwhelm demand, capping upward price progress.
- Acts as an overhead ceiling preventing higher prices
- Formed at previous swing highs and distribution supply pools
- Traders utilize resistance tests to take profits or initiate short trades
Trend Reversal
When prices test a strong historical support or resistance multiple times and fail to breach, buying or selling exhaustion forces a complete trend reversal.
Breakouts & Breakdowns
When heavy volume breaches support or resistance, the old balance breaks, prompting aggressive one-sided momentum expansion toward the next zone.
Role Reversal Principle
Once an overhead resistance is broken, it flips into new support during retests. Conversely, broken support becomes overhead resistance.
How to Draw Error-less 100% Accurate Support and Resistance
Precise rules for plotting valid institutional zones in trending vs range-bound markets
Define your trading timeframe. For intraday analysis, start with 15-minute intervals for clean swing structure.
Identify key swing pivots. Mark zones where at least 2 or 3 major candles formed decisive inflection turns.
You may cut through wicks to connect maximum touches, but never cut through full candle real bodies.
Always zoom out to see historical supply/demand memory before plotting fresh intraday lines.
Treat S&R as a price buffer/zone (5-15 ticks thick) rather than an exact single penny point.
Valid support/resistance tests show decreasing volume on test and surge volume on genuine bounces.
1. In Trending Market
2 Swing PointsConnect the 2 most recent swing points (higher lows in uptrend, lower highs in downtrend) to project the dynamic trendline channel.
2. In Range Market
Highs & Lows BoundaryDraw the horizontal high and low boundary boxes of the consolidation range. Adjust the rectangle to capture the maximum number of touch points.
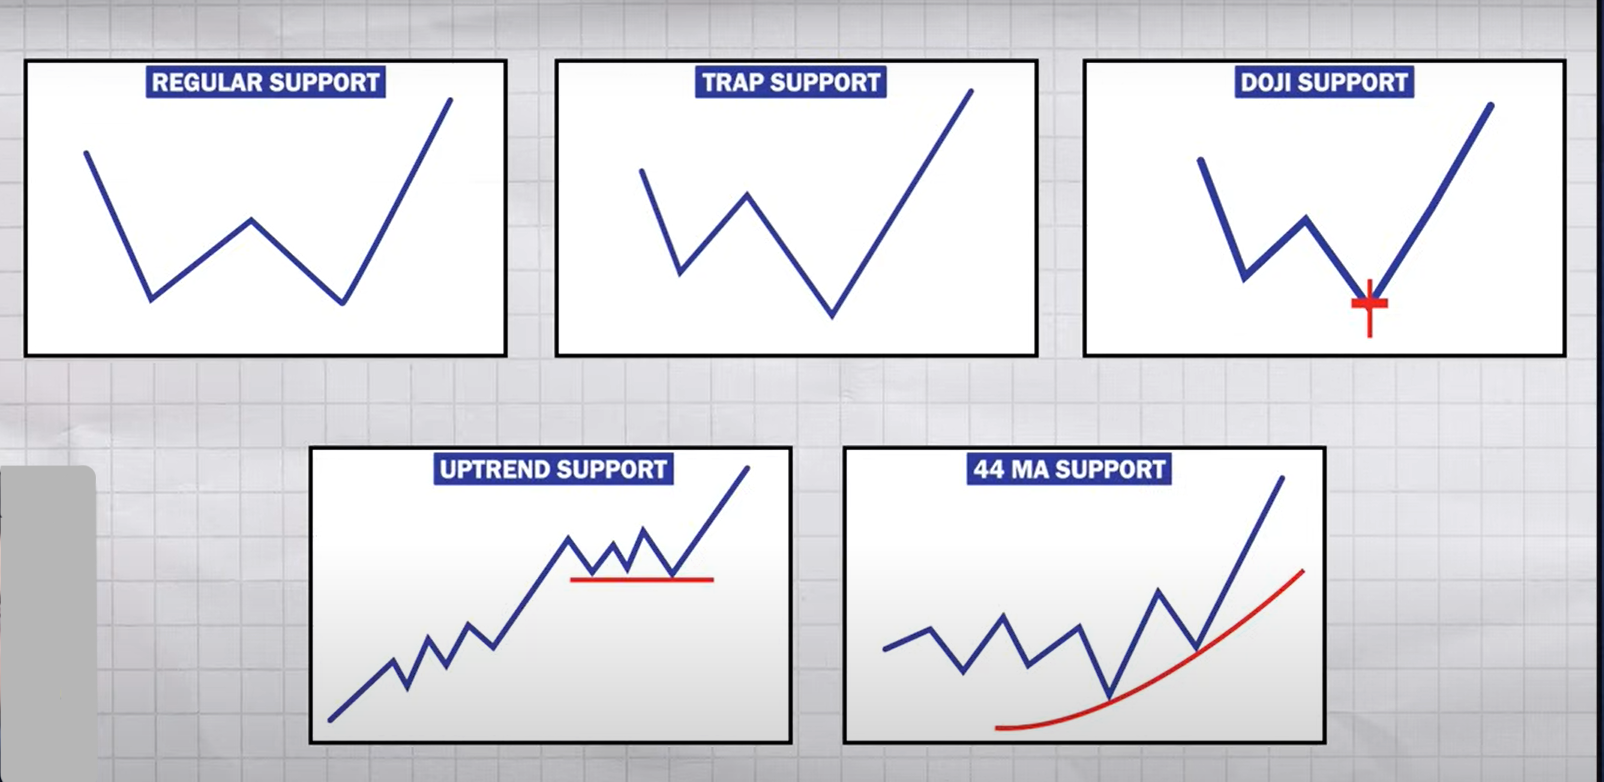
Top 5 Support and Resistance Structural Models
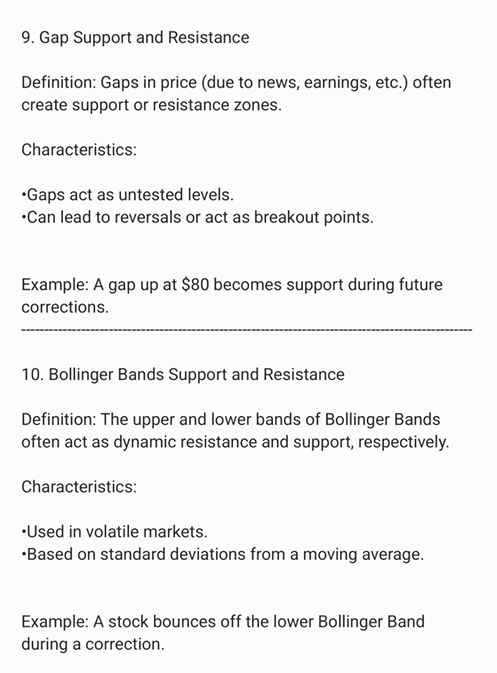
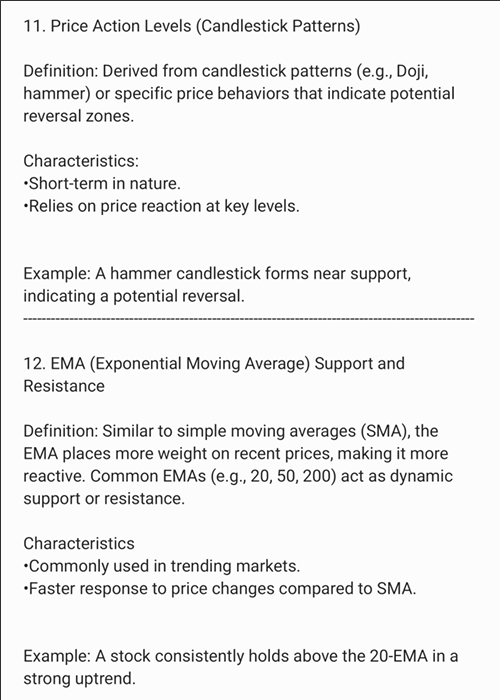
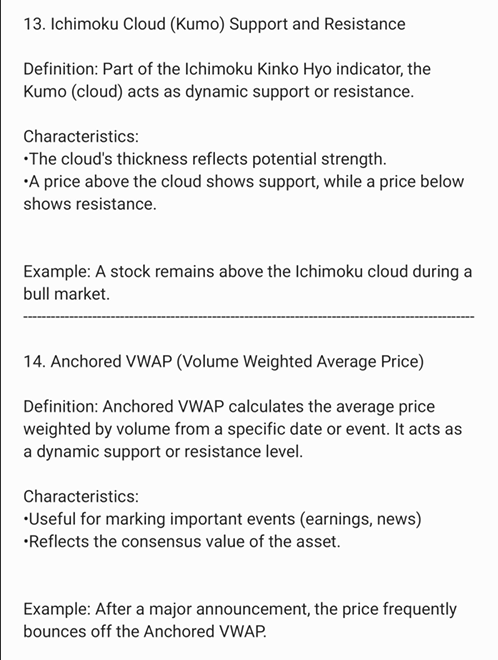
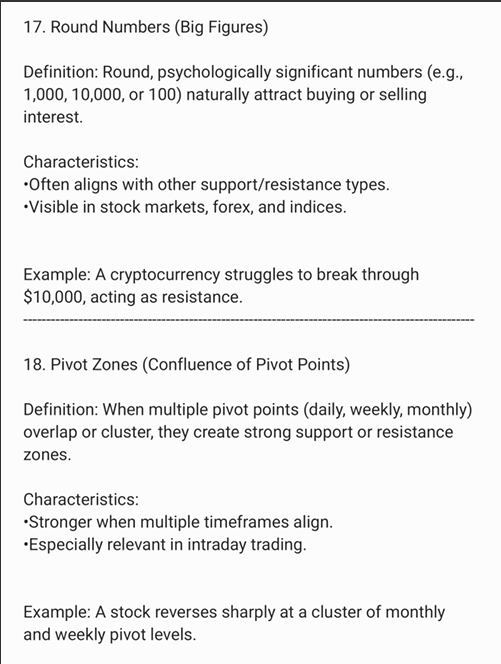
Visual Summary- Regular Support & Resistance: Horizontal swing levels holding steady volume.
- Trap Support & Resistance: Liquidity wicks designed to stop out retail orders.
- Doji Support & Resistance: Equilibrium candles signaling impending reversal.
- Uptrend Support & Resistance: Diagonal dynamic trendlines guiding market trends.
- 44 Moving Average Support & Resistance: Dynamic institutional moving average buffer.
Support & Resistance Methodologies
Each methodology complete with its researched visual chart demonstration, theory, and execution example.
Regular Support
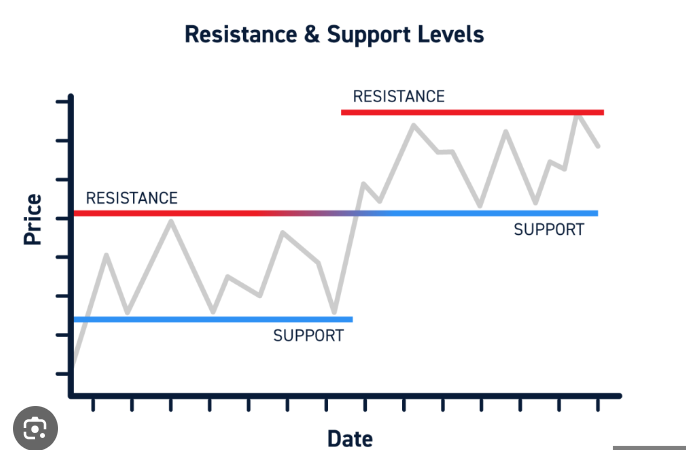
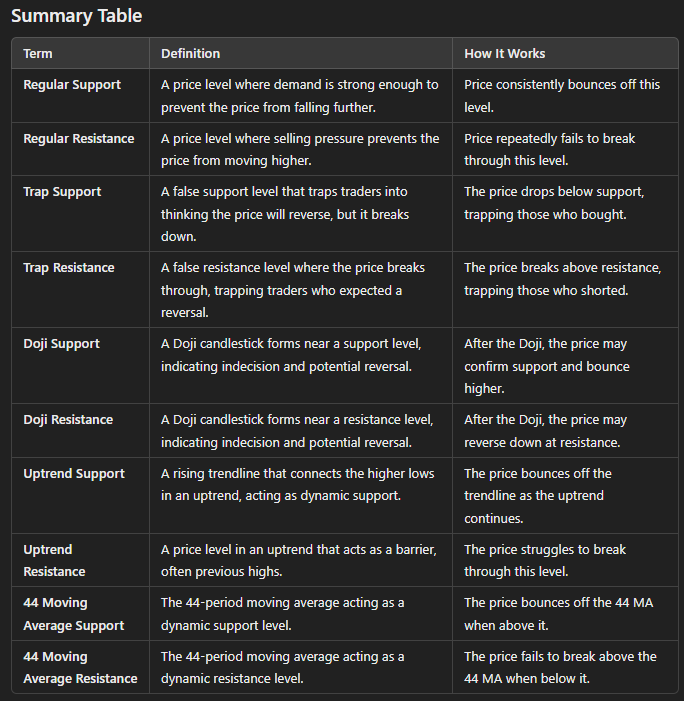
Support is a price level at which a stock tends to find buying interest and where the price typically reverses after falling to that level. It acts as a 'floor' that prevents the price from declining further.
Regular Resistance
Resistance is the opposite of support. It is a price level where selling pressure exceeds buying interest, causing the price to reverse downwards. It acts as a 'ceiling' preventing the price from rising above it.
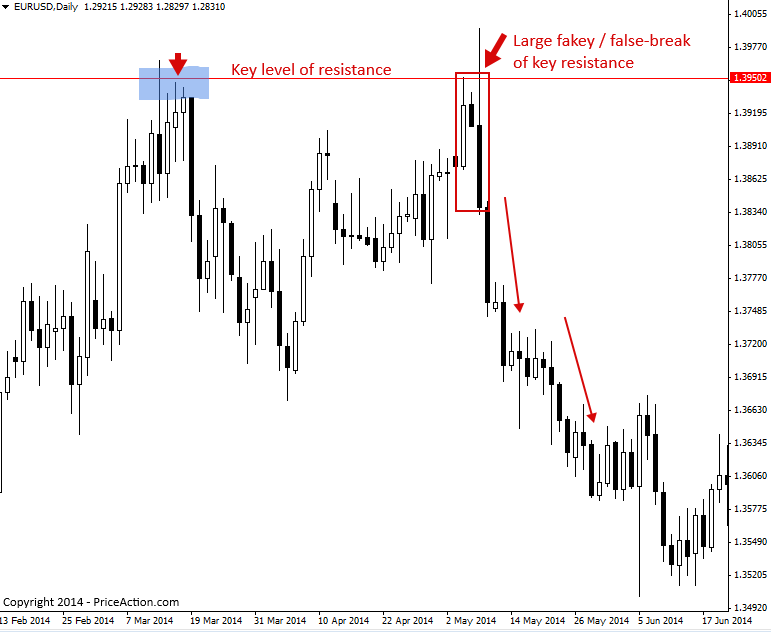
Trap Support
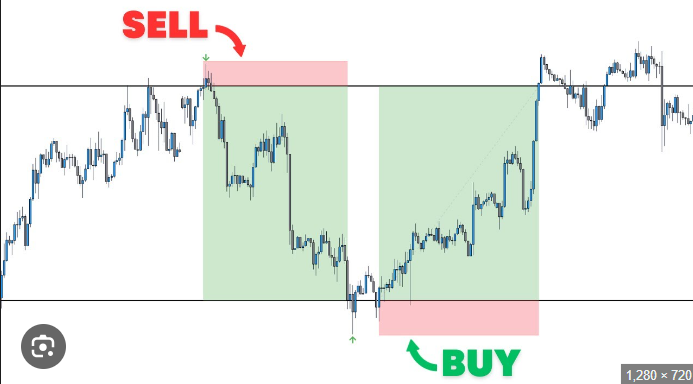
Trap support occurs when the price seems to find support at a certain level, causing traders to believe the stock will reverse and go up. However, the price breaks below this level, trapping those who entered long positions.
Trap Resistance
Trap resistance occurs when a stock price hits a resistance level and many traders expect a price reversal down. However, the price breaks above the resistance, catching those traders who shorted the stock. It is a 'trap' because traders who expect the price to fall are caught off guard when the price breaks higher.
Doji Support
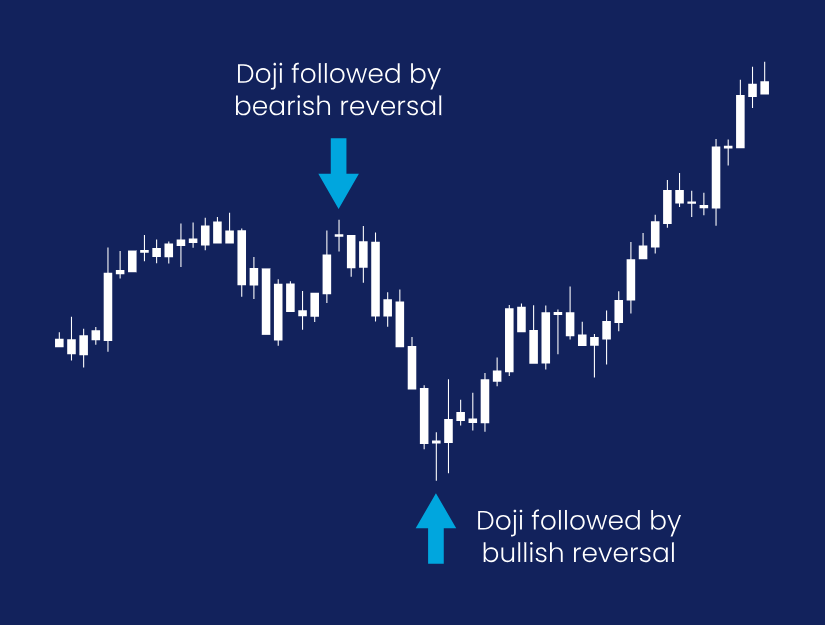
A Doji candlestick pattern, characterized by a small body and long upper and lower shadows, indicates indecision in the market. When a Doji appears at or near a support level, it can signal a potential reversal.
Doji Resistance
When a Doji appears at a resistance level, it indicates indecision at the top of an uptrend. This can be a sign of potential reversal or exhaustion of upward momentum. A Doji at resistance can suggest that buyers are losing control, and a bearish confirmation candle may follow.
Uptrend Support
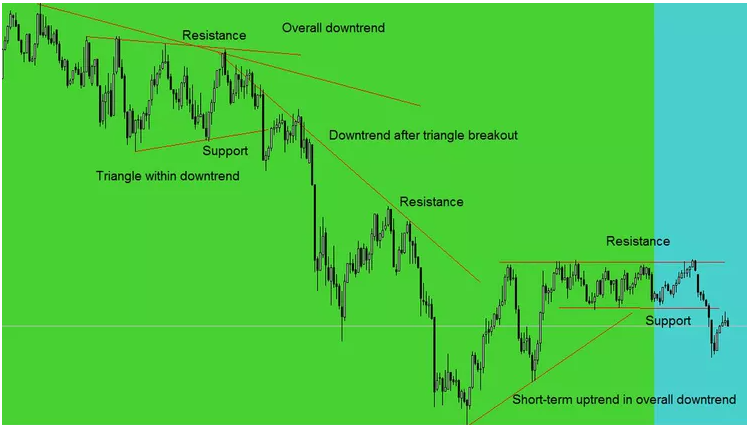
In an uptrend, support refers to the trendline drawn along the lows of the price action (higher lows). This uptrend support represents a rising level where buying interest tends to emerge, and it prevents the price from falling too far. It is a dynamic level that adjusts with time as the price moves higher.
Uptrend Resistance
Resistance in an uptrend is a price level that the stock finds difficult to break through, usually around previous highs. It is a level where selling pressure exceeds buying interest, causing a price pullback. Uptrend resistance can turn into support if the price breaks through it and continues higher.
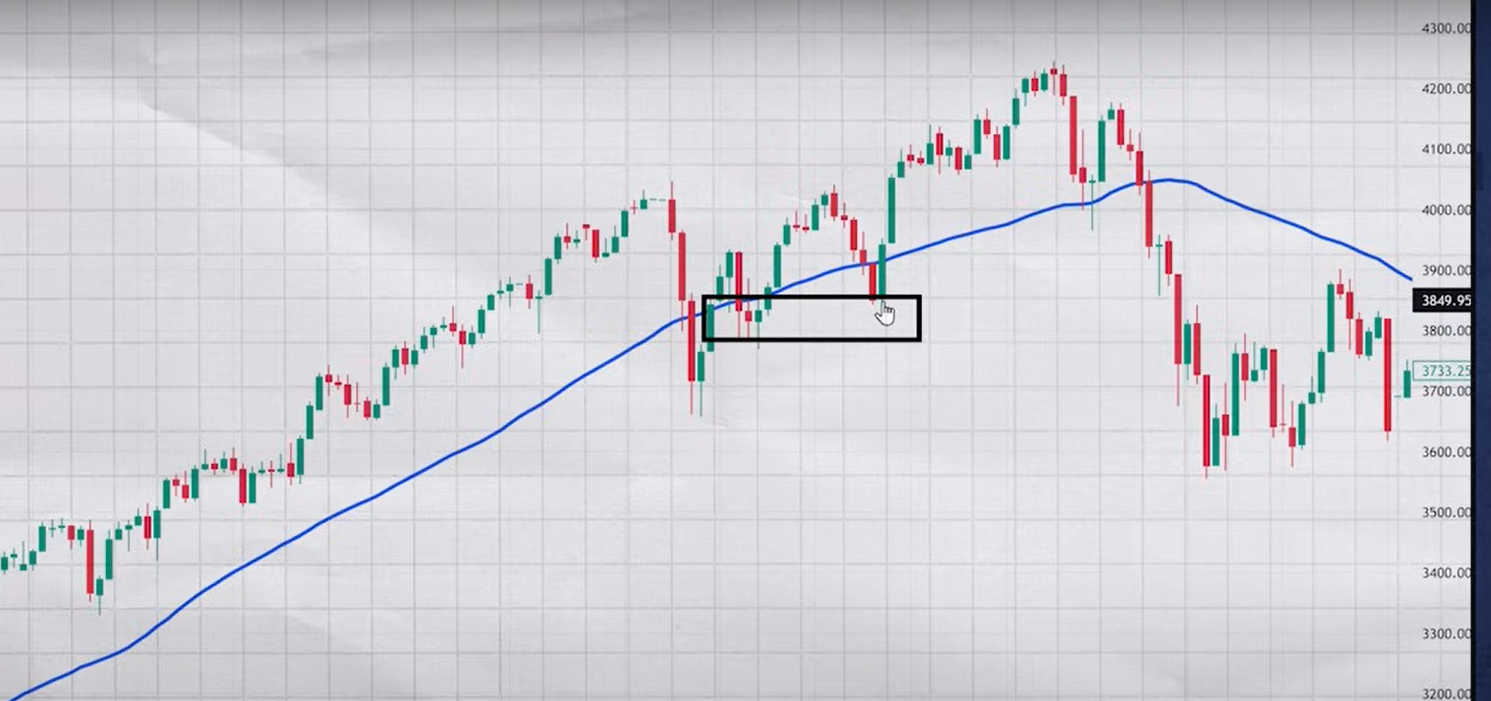
44 Moving Average Support
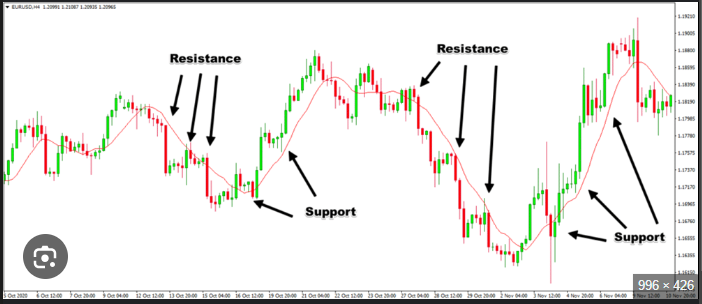
A 44-period moving average can act as a dynamic support level when the price is above it. If the stock price approaches this moving average and bounces off it, the 44 MA is considered to be acting as support.
44 Moving Average Resistance
Similarly, the 44 MA can act as resistance when the price is below it. If the stock tries to move higher and approaches the 44 MA but fails to break through it, the moving average serves as resistance.
Master Blueprint: Top Support & Resistance Comprehensive Summary
Support & Resistance Visual Field Studies
Click any case study chart to inspect the exact entry trigger, stop level, and price action behavior.
Case Study 01: Key Floor Bounce
Multi-touch demand rejection with strong bullish continuation candle
Case Study 02: Ceiling Rejection
Overhead supply absorption followed by bearish rejection pin-bar
Case Study 03: Support Breakout Breakdown
High-volume structural candle close below horizontal base
Case Study 04: Role Reversal Retest
Former ceiling flips into new rock-solid demand cushion upon pullback
Case Study 05: Liquidity Trap Sweep
Wick hunt below support level trapping early short sellers before reversal
Case Study 06: Ascending Channel Support
Diagonal higher-low trendline bounce in alignment with bull trend
Case Study 07: Range Bound Oscillation
Equilibrium trading between well-defined upper and lower horizontal boundaries

Case Study 08: Moving Average Dynamic S&R
Institutional moving average serving as sloping dynamic support
Case Study 09: Double Top at Resistance
Two successive failed attempts to breach resistance sparking downtrend
Case Study 10: Double Bottom at Support
Bullish W-formation reversal with high-volume breakout confirmation
Case Study 11: Trendline Fakeout Trap
False breakout beyond diagonal boundary resulting in rapid snap-back
Case Study 12: Price Gap Retest Zone
Unfilled gap acting as strong institutional liquidity magnet and support
Case Study 13: Multi-Timeframe Confluence
Daily horizontal floor aligning with 15-min lower timeframe entry trigger
S&R Reliability Factors
- • Number of Touches: The more times price tests a level without breaking, the stronger it becomes.
- • Volume Confirmation: Levels accompanied by heavy trading volume indicate institutional presence.
- • Timeframe Confluence: Daily and weekly S&R levels hold far greater weight than 5-minute levels.
- • Recent Activity: Recently formed levels are more relevant than historical levels from months ago.
Key Execution Rules
- • Entry: Buy near confirmed support bounces; short near confirmed resistance rejections.
- • Stop Loss: Position stops slightly below support for longs, and above resistance for shorts.
- • Breakout Confirmation: Wait for a full candle close beyond the zone before entering trend breakouts.
- • Wait for Retest: Conservative traders wait for the role-reversal retest to confirm breakout authenticity.