
Stock Market Learning Index
Complete guide to master stock market trading
Foundation Concepts
Stock Market Basics
What is stock market and how it works?
Market Terms
All important market terminology
Trade Types
Different types of trades
Trading Styles
Various approaches to trading
Candlestick Patterns
Bullish, Bearish & Continuation patterns
Chart Patterns
Technical chart analysis
Support & Resistance
Key price levels identification
Market Analysis
Technical, Fundamental & Price Action
Advanced Trading
Stock Market Analysis Guide
Master the art of trading and investing through comprehensive analysis techniques
Analysis Methods
Technical Analysis
Chart patterns and indicators
Fundamental Analysis
Company financials and valuation
Quantitative Analysis
Numbers and statistical data
Price Action
Pure price movement analysis
Understanding Each Analysis Method
Technical Analysis
Category/Group of indicators reading market on the basis of tools/charts is technical analysis
Fundamental Analysis
Study of Fundamentals of company like how much profit it is generating, its valuation, ROE, growth, company's reputation etc.
Quantitative Analysis
Trading on the basis of numbers, statistics like graphs, pie charts, how much profit is which part or sub-company generating etc. Basically taking trade on the basis of the numbers of that company.
Price Action
Analyzing the price or price movement of stock (Best For Trading)
Fundamental vs Technical Analysis
Fundamental Analysis
Considers a company's financial information and macroeconomic factors to determine the intrinsic value of its stock. This includes analyzing a company's financial statements, such as its balance sheet, income statement, and cash flow statement.
Technical Analysis
Focuses on statistical trends in a stock's price and volume over time to identify trading and investment opportunities. This involves analyzing technical charts and tools to identify patterns and create indicators.
Key Insight
Many investors use a combination of both fundamental and technical analysis to make investment decisions. Fundamental analysis can help identify targets, while technical analysis can help make trading decisions.
Pro Tip: For investing we mainly use FUNDAMENTAL ANALYSIS and for trading like swing or day trading we use TECHNICAL ANALYSIS because short-term chart patterns and news determine price movements over days or weeks.
How To Filter Out Stocks
If you are new to trading and do not know much about filtering stocks and want to play safe in market, you can use these filters in any screener.
ROCE
How efficiently the company uses its money to make profits
Free Cash Flow
Money left after paying all bills, available for savings or investments
Net Income
The final profit after subtracting all costs
Set these filters to high values and search. You will have a list of stocks filtered from 3000+ stocks to just 100-150 stocks approximately. You can research these for safe market play.
Factors to Consider for Investments
Consistently Profit Making
Meaning: The company earns money (makes a profit) regularly, year after year.
Example: Think of a shop that always sells enough products to make more money than it spends every month.
Debt Free
Meaning: The company doesn't owe money to anyone (like banks or lenders).
Example: Imagine someone running a business without ever needing to borrow money—they're financially independent.
High ROE (Return On Equity)
Meaning: This tells us how much profit a company makes with the money its shareholders have invested.
Example: If you give your friend ₹100 to start a small business and they earn ₹20 profit from it, the ROE is 20%. Higher is better.
Ethical Management
Meaning: The people running the company make fair and honest decisions and don't cheat or harm others.
Example: A manager who pays employees on time, treats customers well, and follows laws is ethical.
Specialty in its Sector
Meaning: The company is very good at doing one specific thing in its field (industry).
Example: A company making the best chocolates in the market is specialized in the chocolate business.
Value Investing
Meaning: Buying shares of a company when they are undervalued (cheap) compared to how much the company is really worth.
Example: If you find a ₹100 pair of shoes on sale for ₹50, you're getting great value—similarly, investors look for companies like this.
Good Dividend
Meaning: The company shares a part of its profits with its shareholders as a reward.
Example: If you own a piece of a bakery, they might give you free bread every month as a 'dividend' from their earnings.
Technical Analysis
All about technical analysis and how to do accurate technical analysis of stocks
We do technical analysis of company while trading. In this we highly rely on category/group of indicators and reading market on the basis of tools/charts in technical analysis.
Tools for Technical Analysis
- Drawing Tools
- Candlestick Patterns
- Chart Patterns
- Indicators
Purpose of Tools
- Understand the market condition
- Area of Value
- Entry Trigger
We combine these tools & make high probability trading setups.
Drawing Tools
- → Trendline
- → Trend Channel
- → Support & Resistance (see support and resistance section for more details)
- → Use to find area of value to trade from (buy low and sell high)
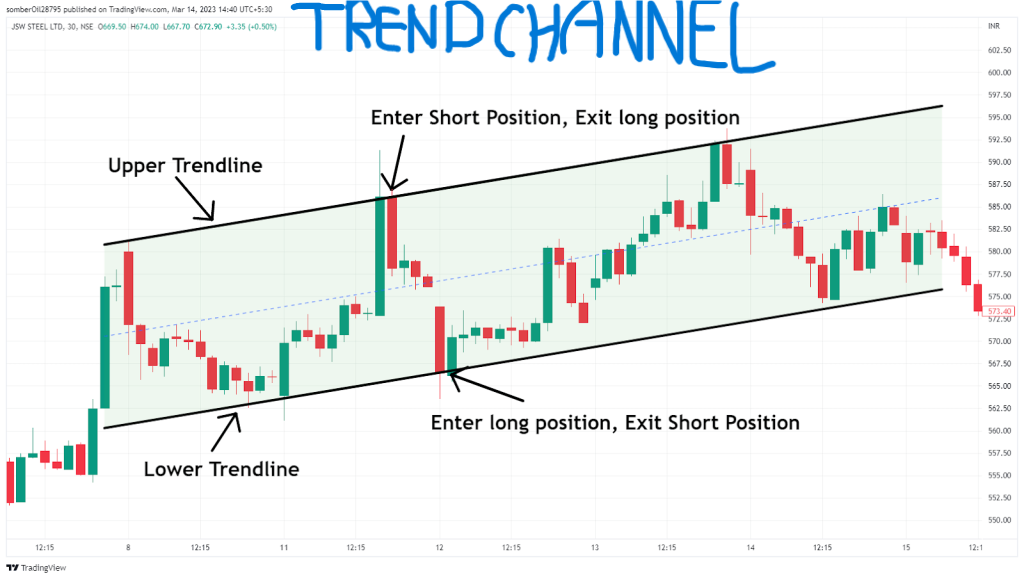
Chart Patterns
- • Quick assessment of strength, weakness, or equilibrium in the market
- • Useful as an entry trigger & understanding market condition
Indicators
- • A tool that takes historical data & applies a formula to it
- • "Summarize" the market price action and useful as an entry trigger
Common Trading Indicators
Volatility Cycle
Best to enter at low volatility period so you know volatility will increase from there. A high volatility period you don't know till when it will be up.
Average True Range
It measures the volatility. It can be used for Stop Loss.
Donchian Channel
Shows 20-day upper band + 20-day lower band + Avg. Can be used to identify potential buying set-up when price touches the outer band.
Moving Average
Mainly used for determining trend direction.
Professional Trading Examples
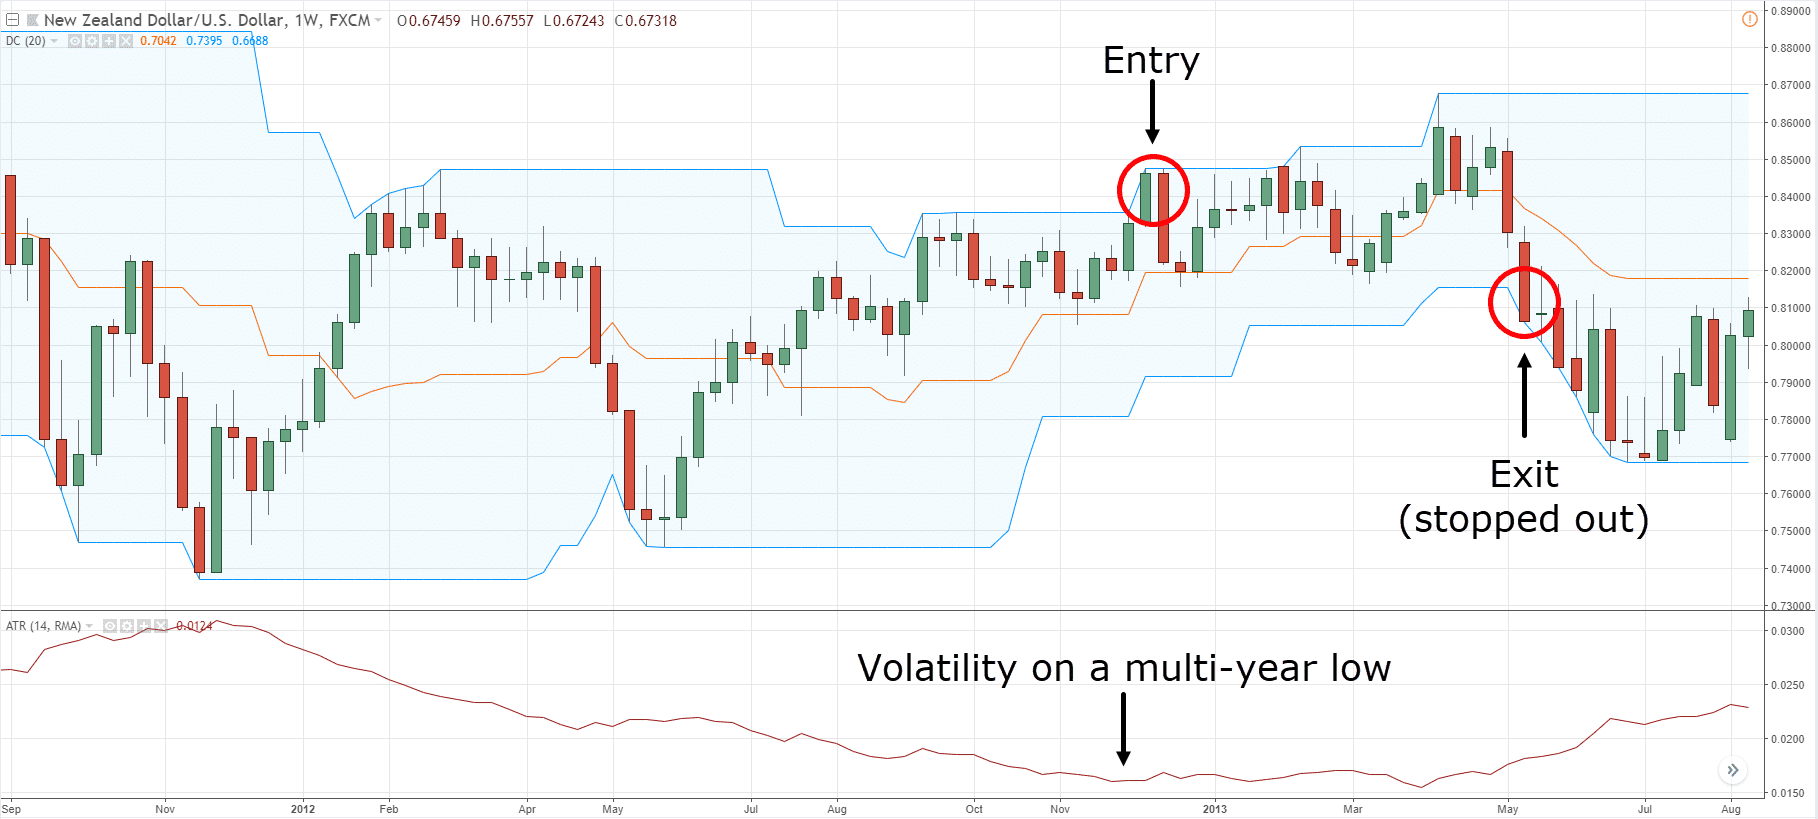
Donchian Channel + ATR
Set both indicators. If candlestick touches 20-day upper band in Donchian Channel and in ATR volatility is low, make entry there & exit when it touches 20-day lower band.
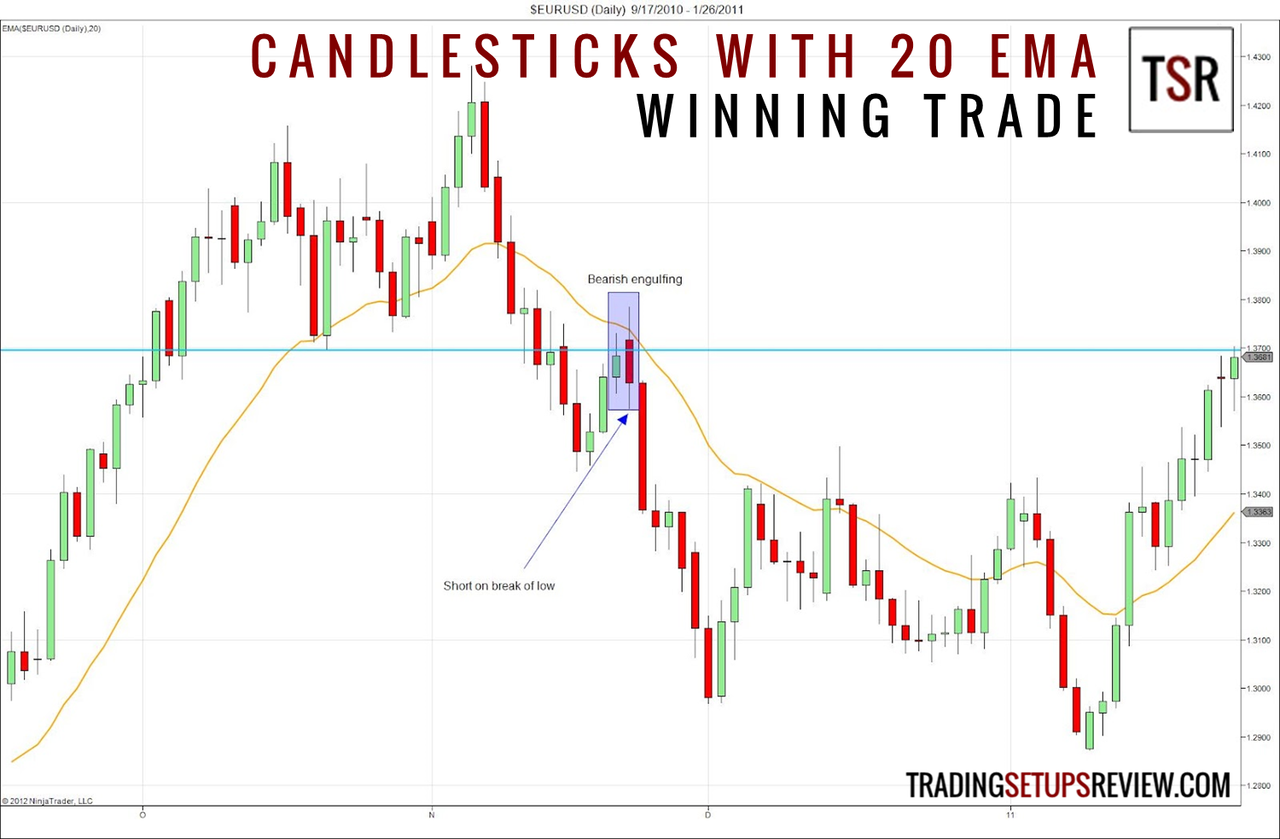
Moving Avg + Candlestick
Helps define area of value and patterns can help decide trend.
Resistance + Candlestick
If Tweezer Top patterns form at resistance level, it has potential for downtrend to start.
Fundamental Analysis
All about fundamental analysis and how to do accurate fundamental analysis of stocks
Study of fundamentals of company like how much profit it is generating, its valuation, ROE, Growth, who is the Owner/CEO, Company Reputation etc.
Fundamental Analysis Types
1. Qualitative Analysis
Analysis of those things which cannot be calculated through numbers like its product, service, reputation, competitors, management, future plans etc.
2. Quantitative Analysis
Analysis of company's profile on the basis of numbers like Balance Sheet, Income Statement, Cash Flow Statement & Financial Ratios.
Stock Selection Criteria for Your Hard-Earned Money
Additional Company Analysis Factors
1. Business Model
You should always see company's business model to see whether it is future proof or have some downfall in future if you are seeing for long term. EXAMPLE → CHEGG was one of the most growing companies for last years but after AI became famous and available to public its valuation was down by literally 95%+ in just last 2 years because now people use AI on their phones or any device for free to get answers.
2. Competitive Advantage
The company should have competitive advantages from their peers or should have edge. Example → if you go to buy chips most of the people go for lays just like that the company you choose should have some competitive advantage in its sector for good growth.
3. Special Key Advantage
Company should have some special advantages. Example → You see Hindustan Unilever have access to all the cities/villages...every corner of this Country so if they have X number of products and they think to launch their X+1th product so they don't have to struggle for delivering that to everywhere because they are present there with their old products.
4. Special Ratios
PRICE TO BOOK VALUE RATIO, PRICE TO EARNING RATIO, RETURN ON CAPITAL EMPLOYED, RETURN ON EQUITY SHOULD BE MORE THAN 10% FOR GOOD GROWTH
Financial Terms Reference
Price Action Analysis
The best way to analyze stocks through pure price movement
→ Analyzing the price or price movement of stock OR study of price is known as price action analysis.
→ Price Action is more precise than any other analysis
Technical Analysis vs Price Action
In technical analysis we rely on indicators, but indicators are lagging in nature that means they tell you the things that happened, and they create noise in chart means after putting indicators that chart becomes full and doesn't look good for analysis.
As you can see the chart looks so messy that it is very difficult to do analysis on this if we only rely on indicators and use too many indicators.
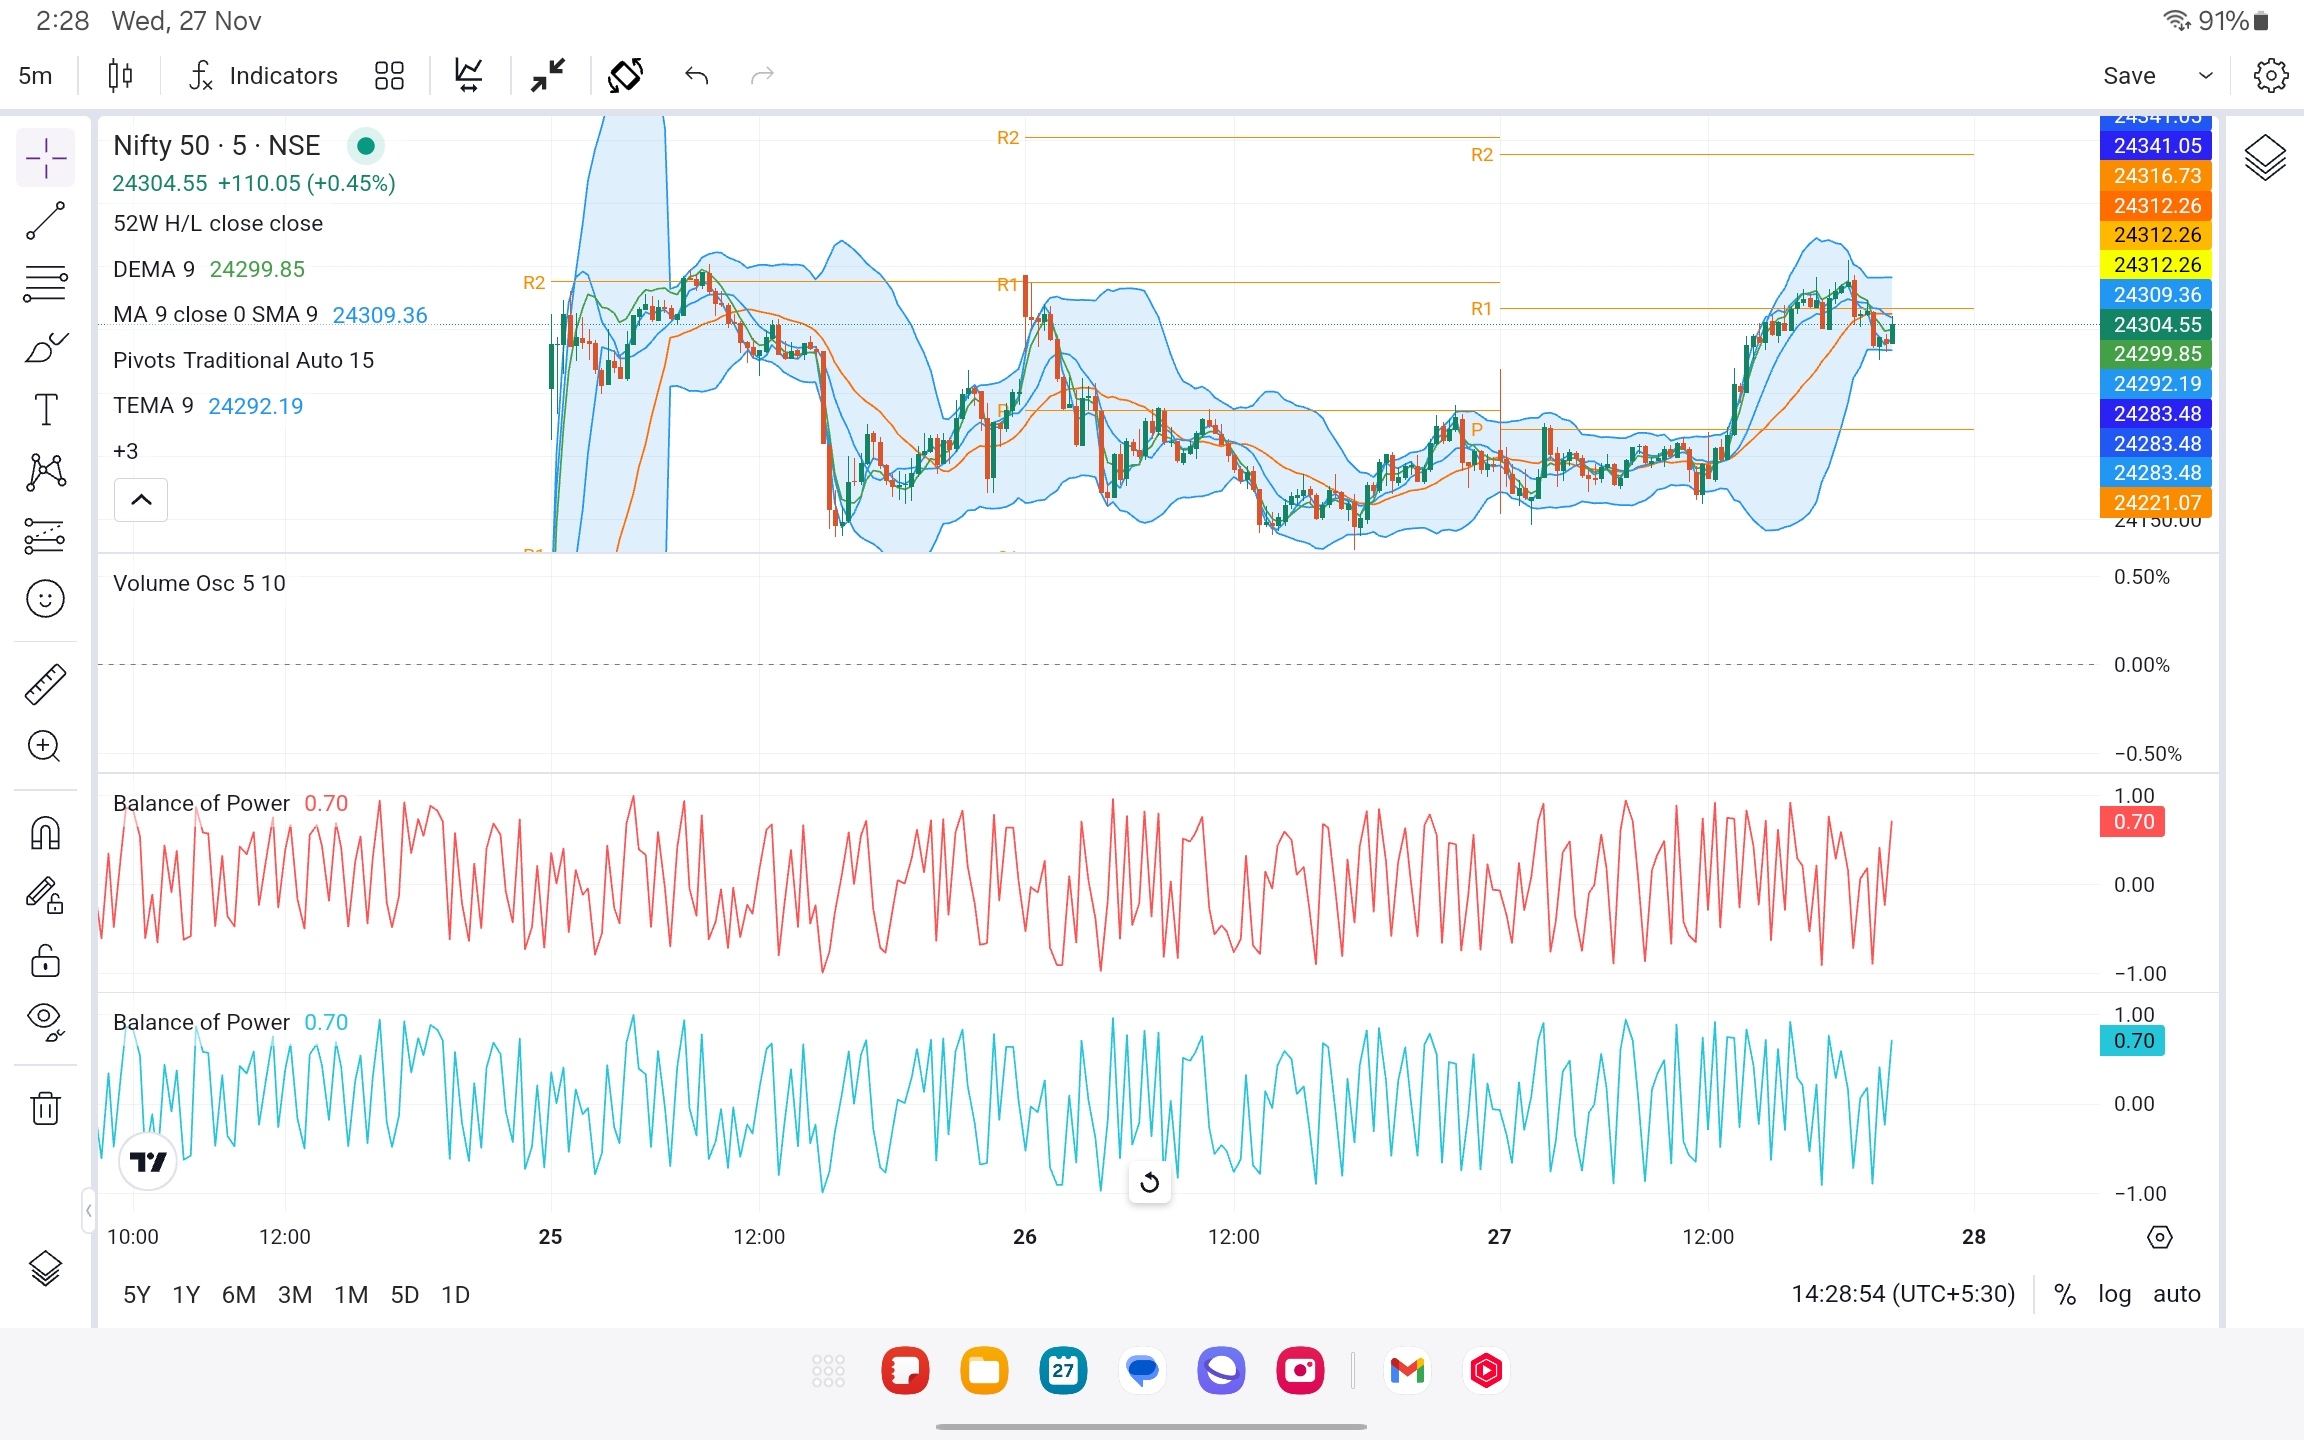
Example - Noisy/messy Chart
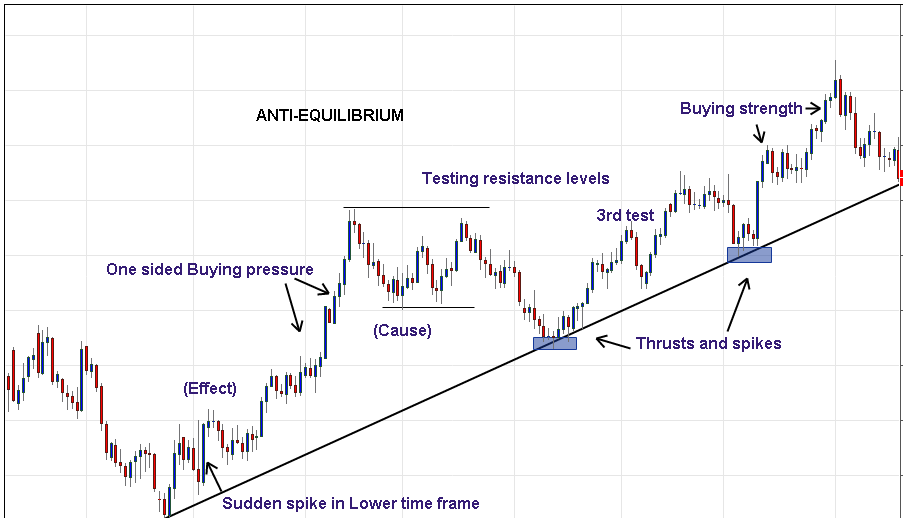
Price Action Strategies
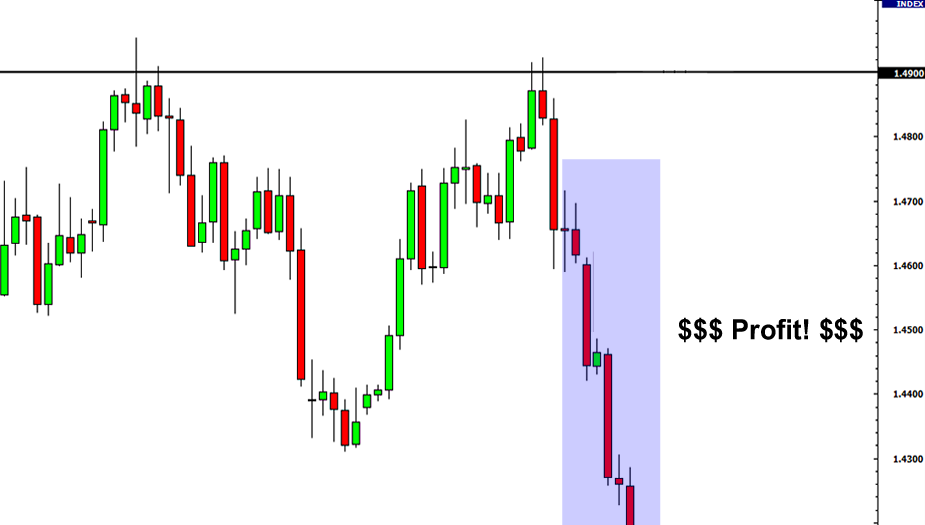
Trend Trading
Taking trades with the trend like if the market is going up or given breakout and charts and candlestick patterns are also indicating that the price may go more bullish so take upper calls and vice versa with bearish market.
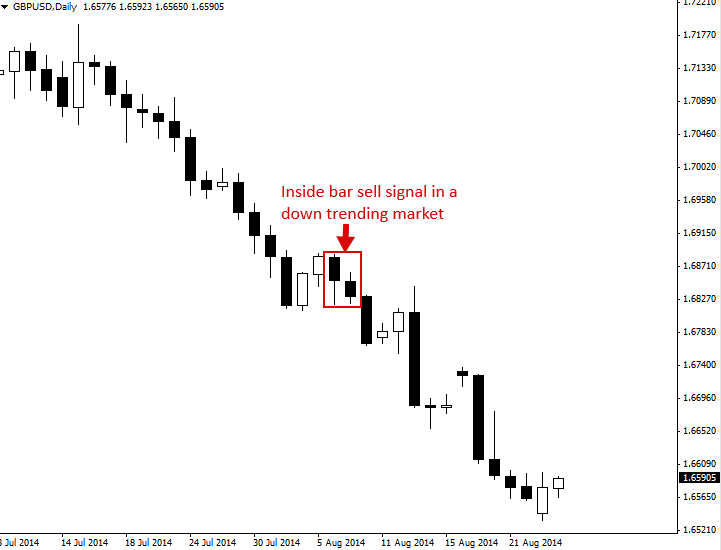
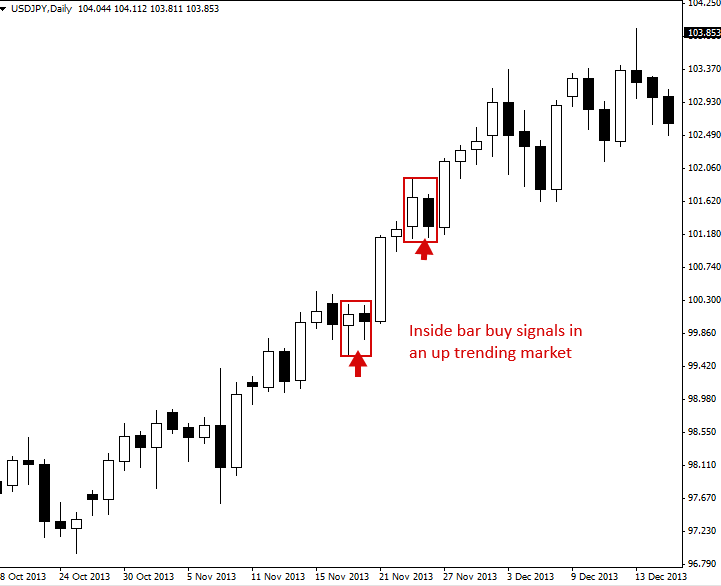
Inside Bar Strategy
Inside bars can be traded in trending markets in the direction of the trend, when traded this way they are typically referred to as a 'breakout play'. The classic entry is to place a buy stop or sell stop at the high or low of the mother bar.
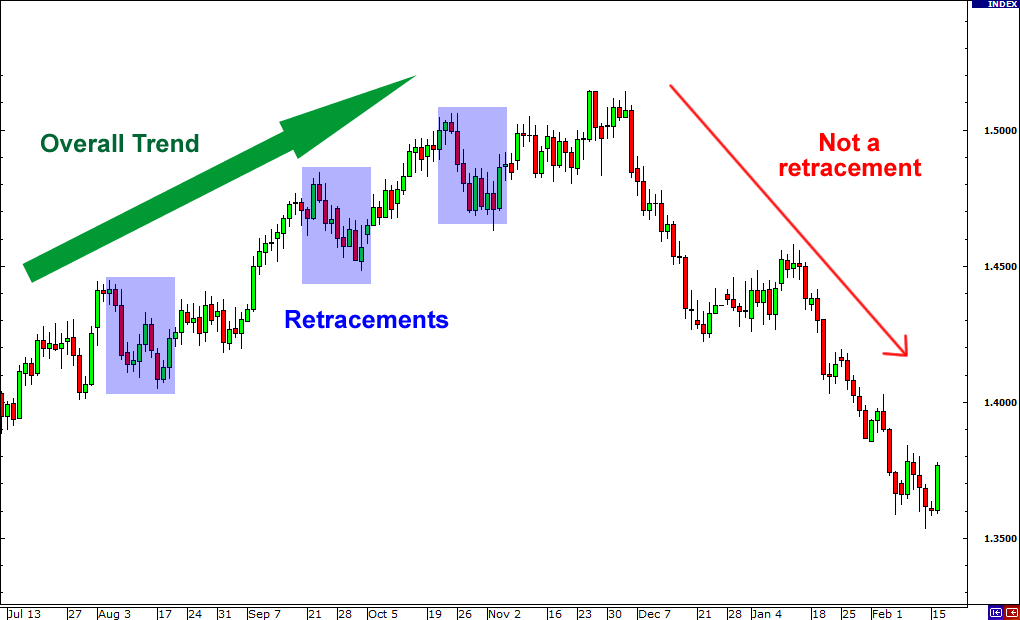
Retracements
Short term pullback or little correction is called retracement. A retracement is a technical term used to identify a minor pullback or change in the direction of a financial instrument. Retracements are temporary in nature and do not indicate a shift in the larger trend.
Reversal
A reversal is when the direction of a price trend has changed, from going up to going down, or vice-versa. Traders try to get out of positions that are aligned with the trend prior to a reversal. When it starts to occur, a reversal is not distinguishable from a pullback initially.

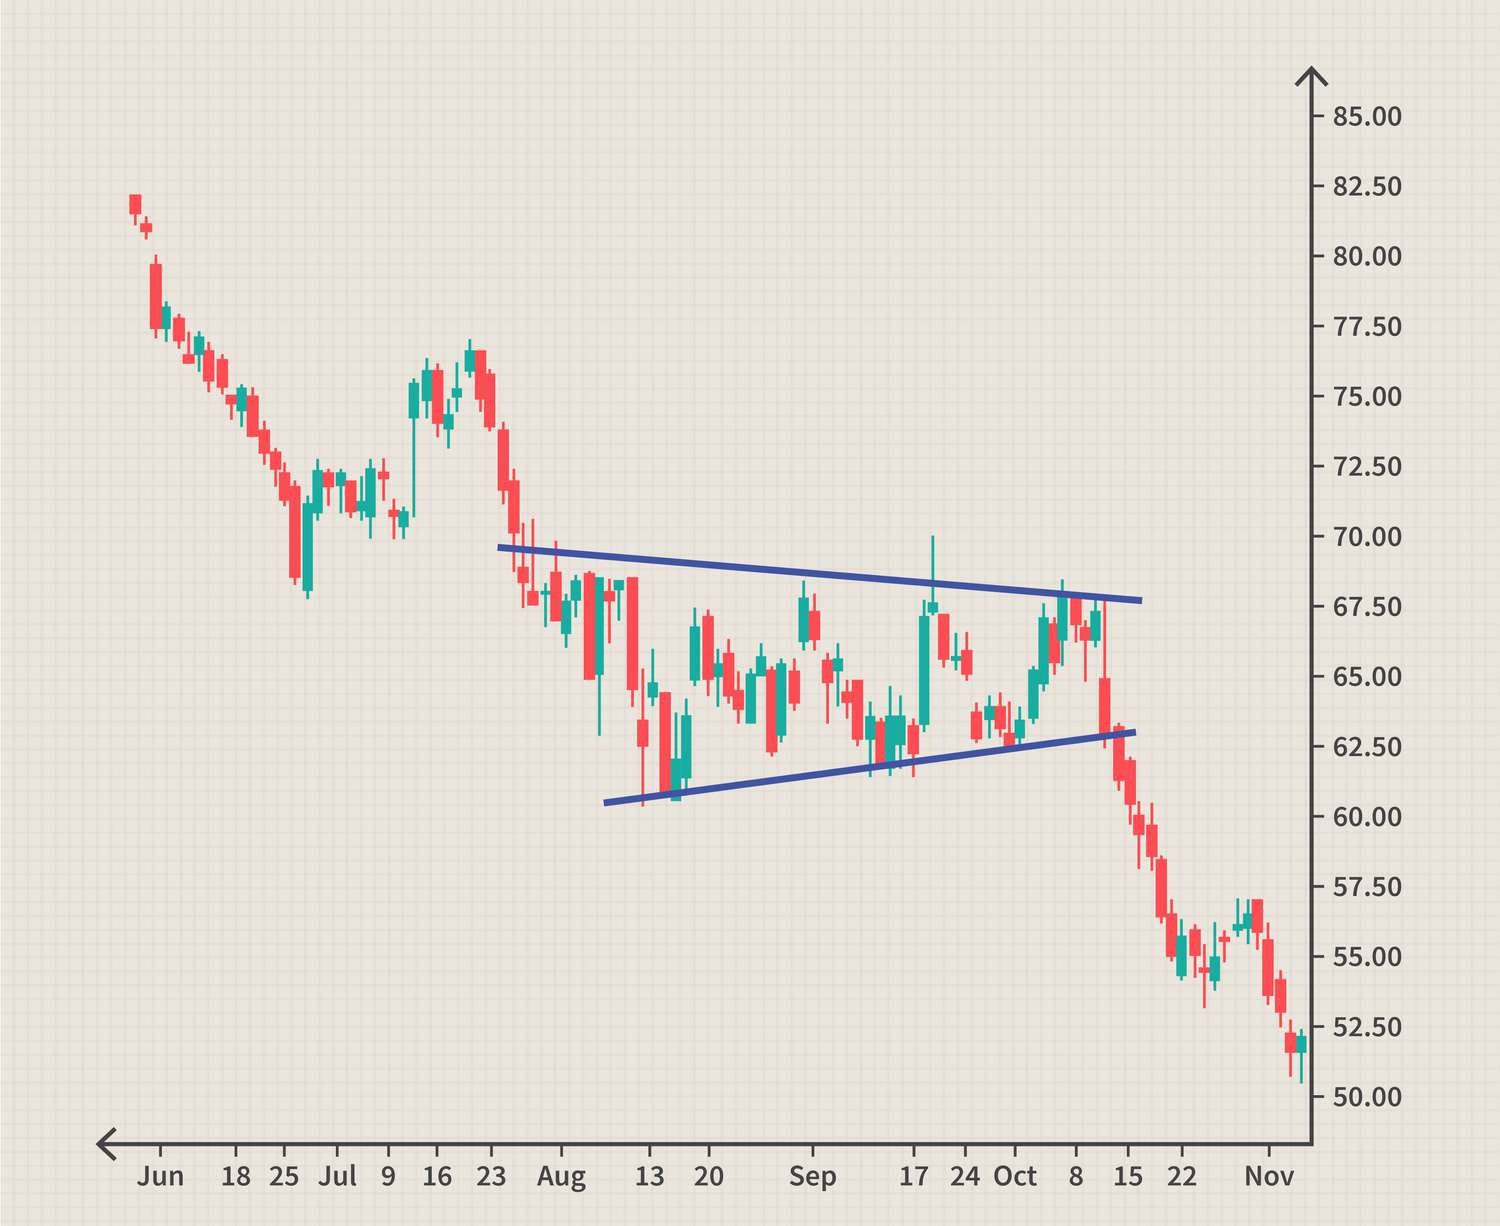
Breakouts & Breakdowns
Breakout → When the price of a security moves above a resistance level, signaling the start of an upward trend. Breakdown → When the price falls below a support level, signaling the start of a downward trend.

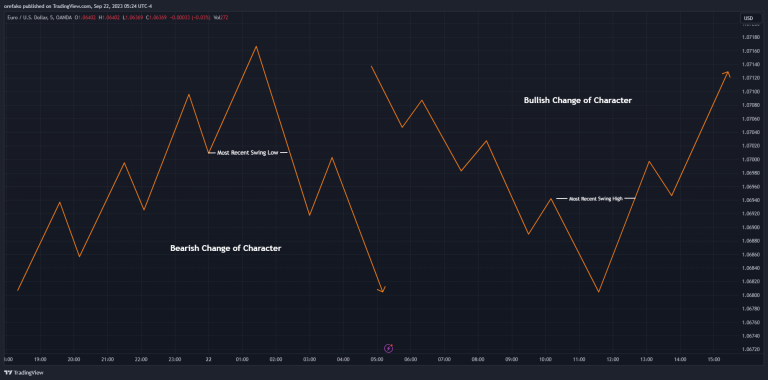
Change of Character
A Change of Character (ChoCh) in trading is a significant shift in the market's behavior or trend. It can indicate that a trend is losing momentum and a new trend is forming. It can be signaled by: a break in a previous trend line, an unusual volume spike, and a sudden increase in volatility.
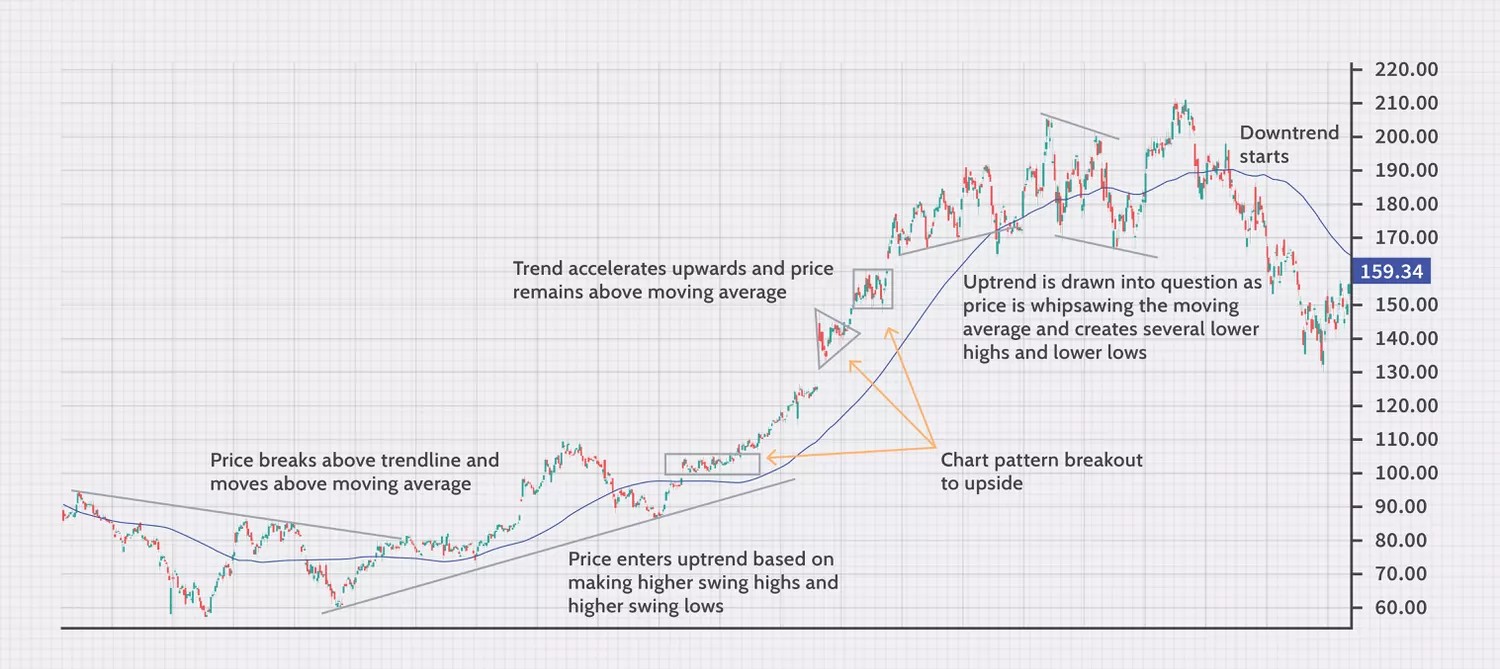
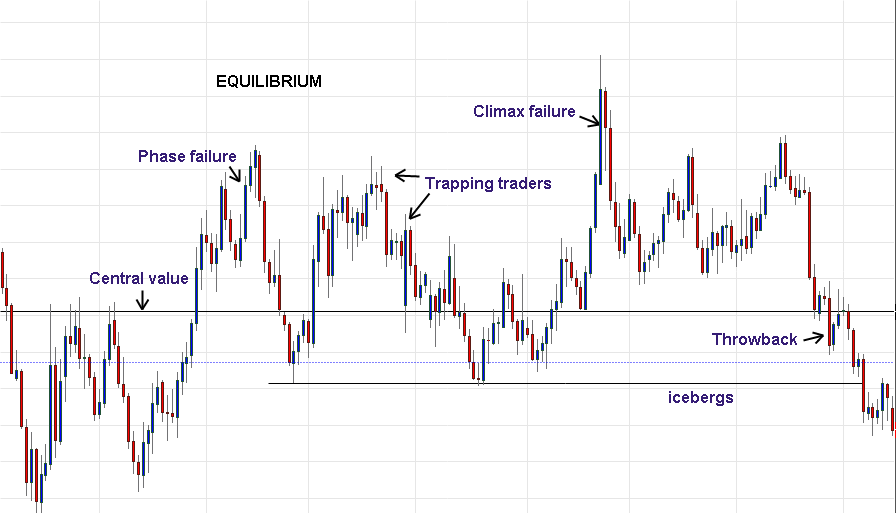
Market Structure
Traders can employ a range of techniques to effectively utilize market structure. One key aspect is identifying key support and resistance levels. Support levels are areas where buying pressure has been strong enough to prevent further price declines. Resistance levels are areas where selling pressure has halted price advances.
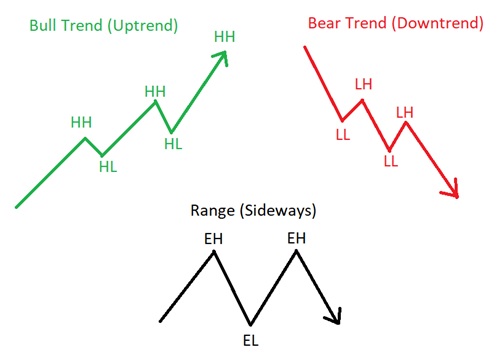
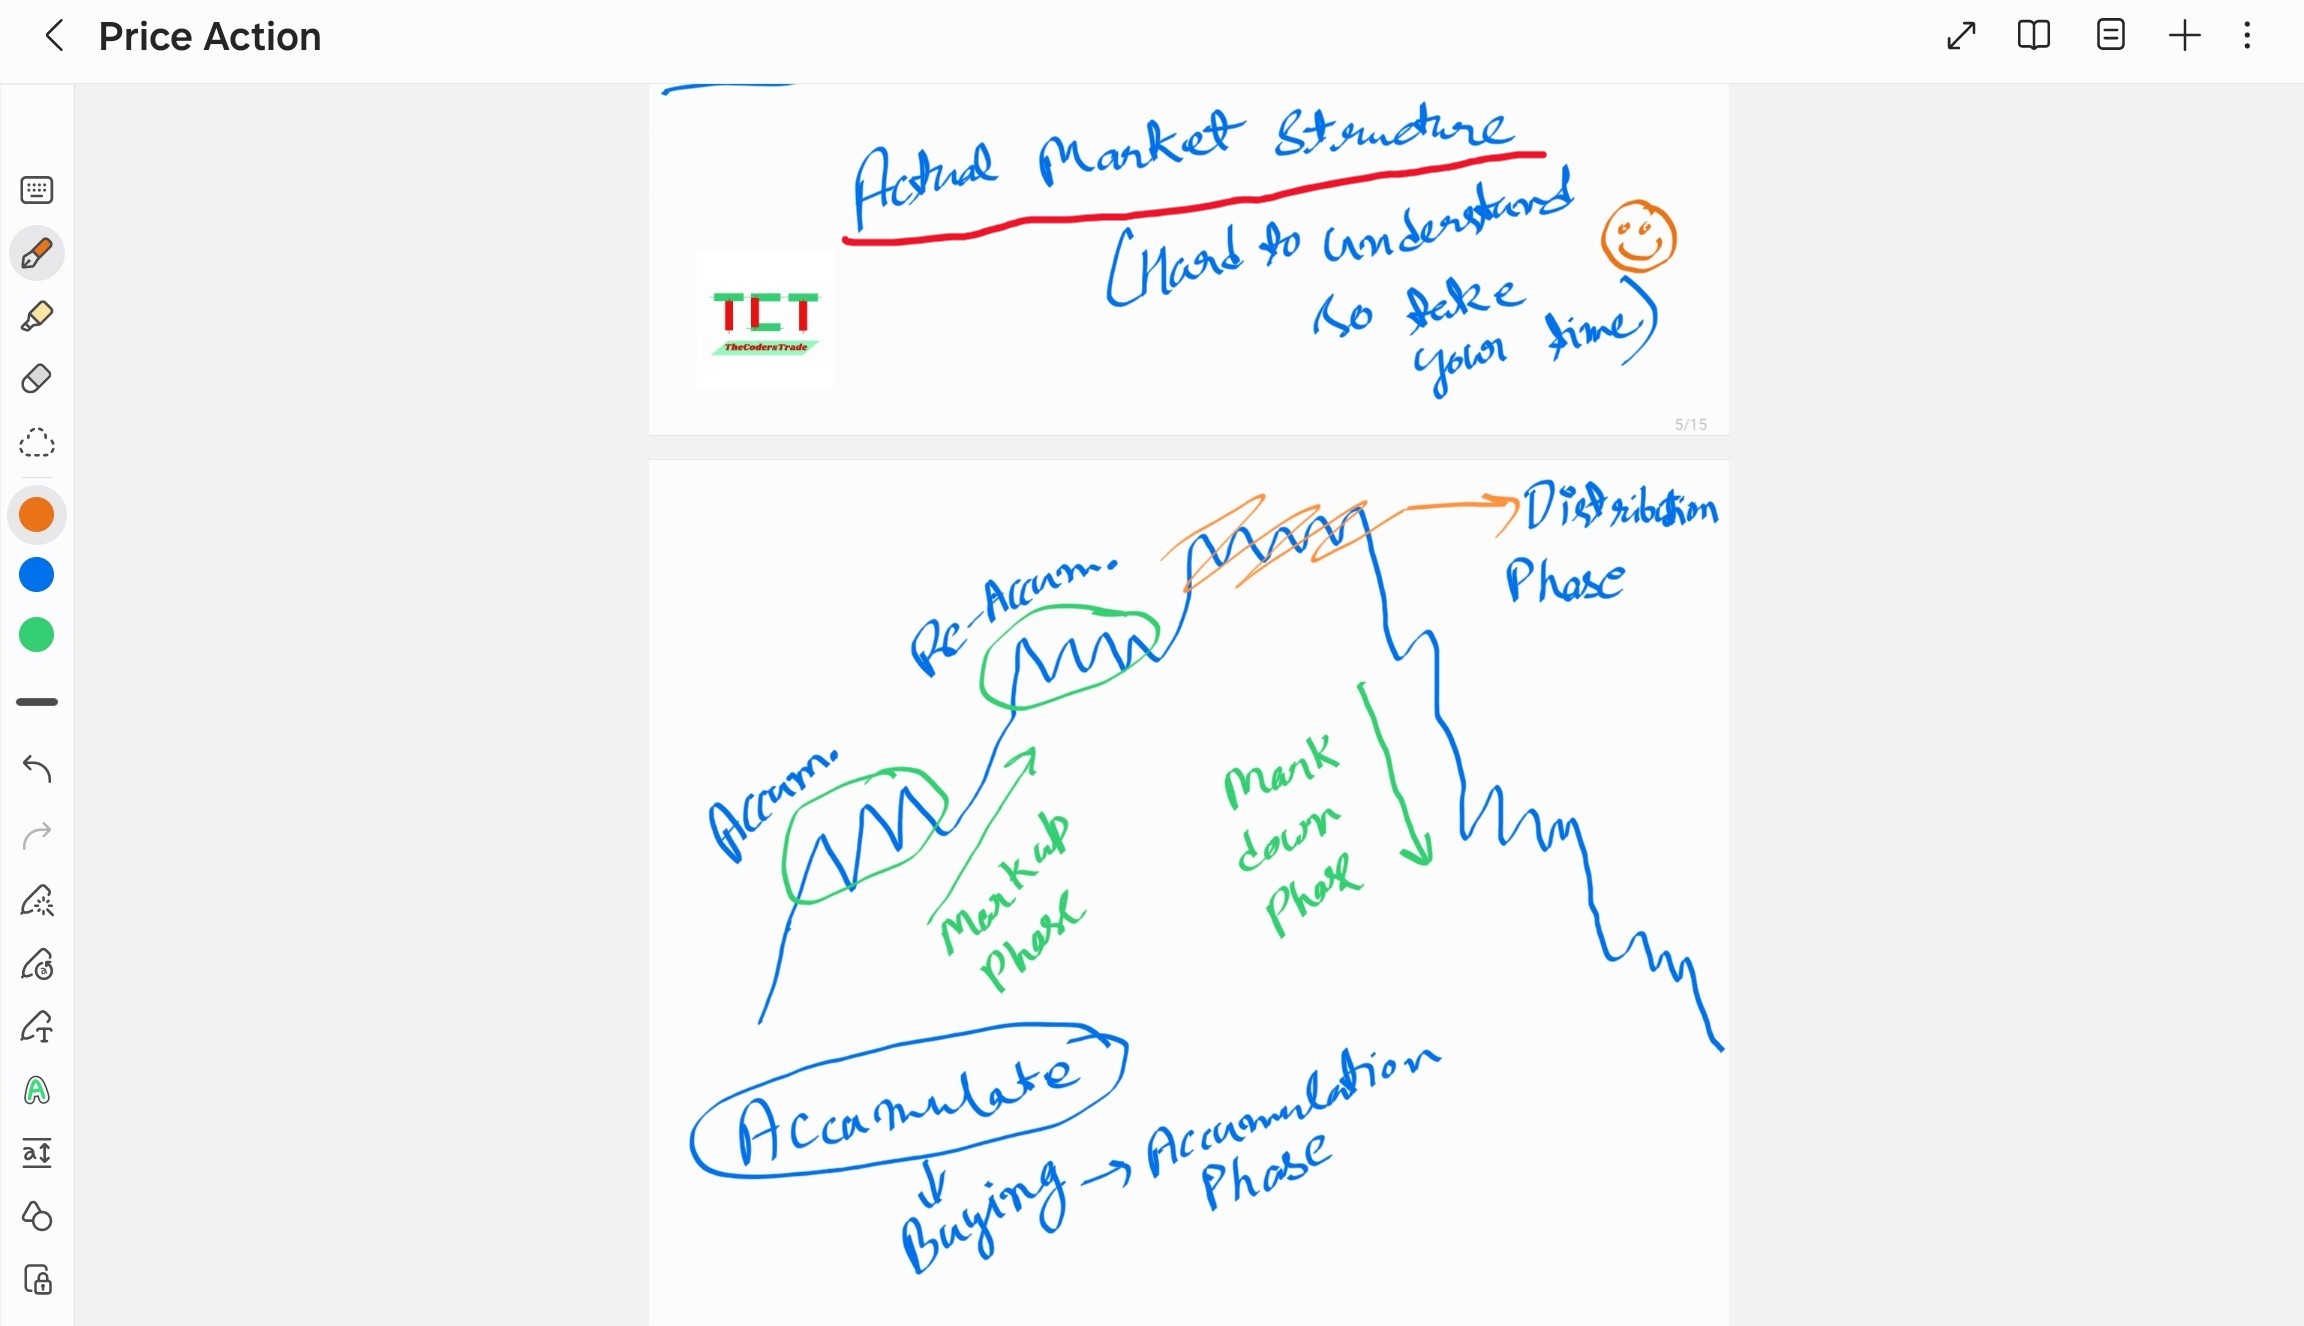
Actual Market Structure
Market structure is a representation of price action over time, while price action is the movement of prices up, down, or sideways. Market structure can be broken down into four stages: accumulation, advancing, distribution, and declining.
Markup Phase
The markup phase follows, measured by the slope of the new uptrend. Pullbacks to new support offer buying opportunities.
Markdown Phase
The slope of the new downtrend measures the markdown phase. This generates its own redistribution segments.
Market Structure Examples
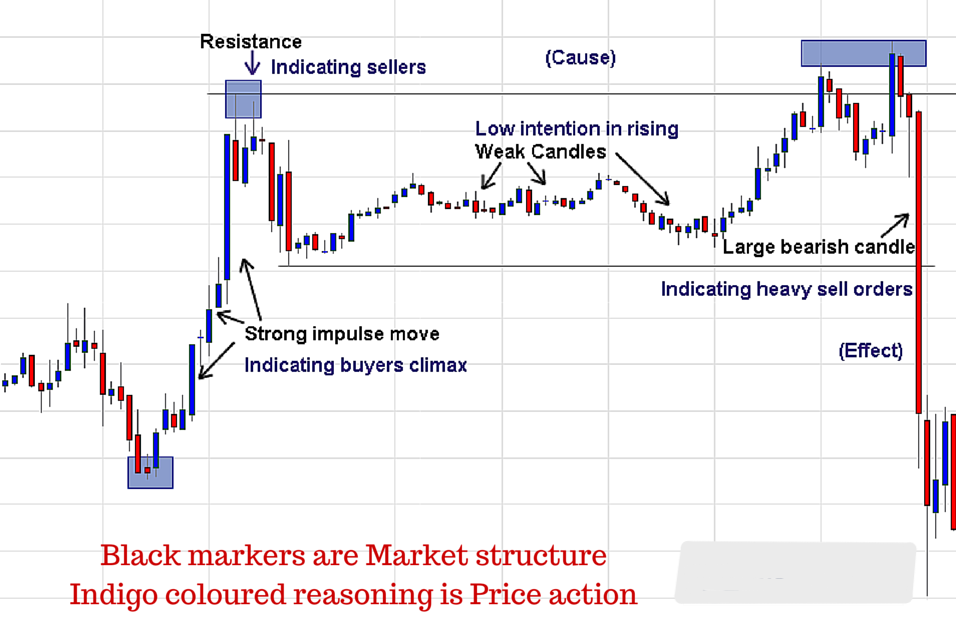
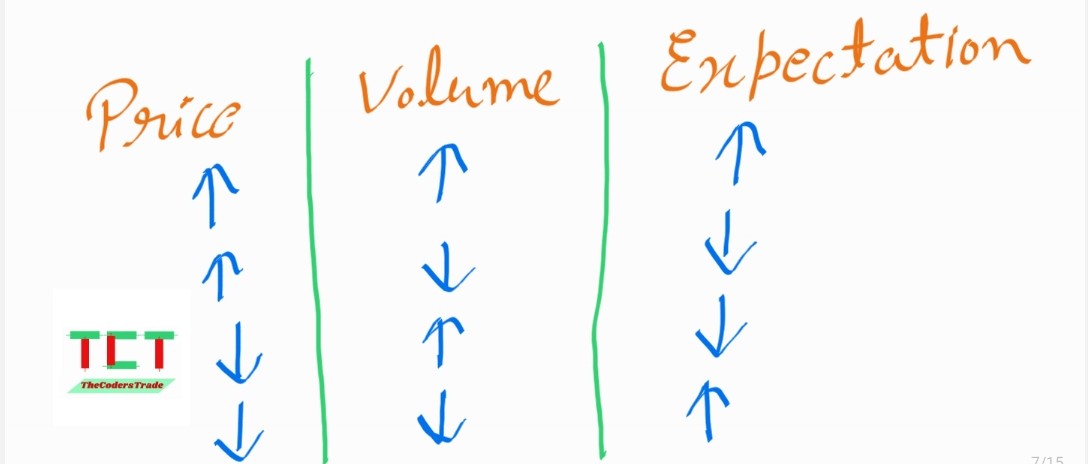
Other Important Terms for Price Action
Demand & Supply → Hero of Price Action
• Demand ↑ = Supply ↓
• Supply ↑ = Price ↓
Support & Resistance
It is never just a line it is a zone i.e never make a line for support and resistance make a zone of area so that it can be easy to take entry.
FOR MORE INFO ABOUT SUPPORT AND RESISTANCE PLEASE REFER TO SUPPORT AND RESISTANCE SECTION
Candlesticks
FOR MORE INFO ABOUT CANDLESTICKS AND PATTERNS PLEASE REFER TO CANDLESTICKS SECTION
Volume
How much quantity is been traded at that moment is called volume.
Candlesticks Pattern + Support & Resistance + Volume + Chart Patterns etc.