
Stock Market Learning Index
Complete guide to master stock market trading
Foundation Concepts
Stock Market Basics
What is stock market and how it works?
Market Terms
All important market terminology
Trade Types
Different types of trades
Trading Styles
Various approaches to trading
Candlestick Patterns
Bullish, Bearish & Continuation patterns
Chart Patterns
Technical chart analysis
Support & Resistance
Key price levels identification
Market Analysis
Technical, Fundamental & Price Action
Advanced Trading
⇜Option Trading⇝
Option trading in the stock market is the combination of knowledge, strategy, discipline and risk management.
It is mainly of two types →
• Option Buying
• Option Selling
Before doing option trading you must know the terms and understand the basics that can be useful for making profits...
Key Concepts for Options Trading
1. Understanding the Basics
Options Terminology: Know key terms like calls, puts, strike price, expiration date, premium, intrinsic value, and extrinsic value. Options Pricing: Understand the factors affecting options pricing, including the Greeks (Delta, Gamma, Theta, Vega, and Rho).
2. Market Research
Fundamental Analysis: Study the underlying assets financials, industry trends, and macroeconomic indicators. Technical Analysis: Use charts, patterns, and technical indicators to predict price movements. Volatility Analysis: Monitor implied volatility (IV) and historical volatility to assess market sentiment and option premiums.
3. Strategy Development
Use specific strategies based on market conditions: Bullish Strategies: Long calls, bull call spreads. Bearish Strategies: Long puts, bear put spreads. Neutral Strategies: Iron condors, straddles, strangles. Volatility Plays: Calendar spreads, Vega-sensitive trades. Match your strategy to your risk tolerance and market outlook.
4. Risk Management
Position Sizing: Avoid over-leveraging by risking only a small portion of your capital on any single trade. Stop-Loss and Exit Strategies: Predefine your loss limits and profit targets. Hedging: Use options to hedge your portfolio against adverse market movements.
5. Time Management
Options are time-sensitive due to time decay (Theta). Plan trades with an understanding of how time impacts option value.
6. Capital and Liquidity
Ensure sufficient capital for margin requirements, especially for advanced strategies. Trade liquid options with tight bid-ask spreads to minimize trading costs.
7. Brokerage Platform
Choose a reliable trading platform with advanced tools, low fees, and robust support for options trading.
8. Continuous Education
Stay updated with market news, earnings reports, and economic data. Learn advanced concepts, such as volatility skew, synthetic positions, and adjustments.
9. Emotional Discipline
Avoid impulsive decisions based on fear or greed. Stick to your trading plan and review performance regularly.
10. Tax and Regulatory Awareness
Understand the tax implications of options trading in your region. Be aware of the rules governing options to avoid penalties or restrictions. By combining these factors with practice and experience, you can enhance your chances of success in options trading.
Some differences b/w Option Buying and Option Selling

‹Options Chain›
An Option Chain, also known as an Options Matrix, is a comprehensive table displaying all available option contracts for a specific stock, index, or asset. It is a critical tool for traders and investors to analyze options trading opportunities. Below is a complete explanation for understanding and presenting an option chain, along with fully described points and examples.
1. What is an Option Chain?
An Option Chain is a table displaying the available Call (CE) and Put (PE) option contracts for an underlying asset (like a stock or index) with details such as strike prices, premiums, open interest, and more. It's an essential tool for analyzing options trading opportunities.
For example, if you're analyzing the Nifty50 option chain, it will list contracts for different strike prices (e.g., ₹24,500, ₹24,600, etc.) and expiries (weekly or monthly).
2. Key Terms in an Option Chain
Underlying Asset
The stock or index on which the option contract is based.
Example: Nifty50, Bank Nifty, Reliance Industries, TCS, etc.
Call Option (CE)
Gives the buyer the right to buy the underlying at a specified price (strike price) on or before the expiry.
Example: If you buy a Nifty50 Call Option at a strike price of ₹24,600 for a premium of ₹120, you can buy Nifty50 at ₹24,600, irrespective of the market price.
Put Option (PE)
Gives the buyer the right to sell the underlying at a specified strike price.
Example: If you buy a Nifty50 Put Option at a strike price of ₹24,500 for a premium of ₹80, you can sell Nifty50 at ₹24,500.
Strike Price
The price at which the option can be exercised.
Example: In the option chain for Reliance Industries, you may see strike prices like ₹1,300, ₹1,400, and ₹1,450 etc.
Expiration Date
The last date on which the option can be exercised.
Example: Weekly Options expire every Thursday, while Monthly Options expire on the last Thursday of the month.
Premium
The price you pay to buy an option contract.
Example: If the premium of a Nifty50 Call at ₹24,600 is ₹100, the total cost for one contract (Lot size of 50) is ₹100 × 50 = ₹5,000.
Open Interest (OI)
The total number of outstanding contracts for a specific strike price.
Example: If the OI for a Nifty50 ₹24,500 Call is 1,50,000, it means 1,50,000 contracts are open.
Volume
The number of contracts traded during the day.
Example: If the volume for a strike price of ₹24,700 is 20,000, it means 20,000 contracts were traded.
In-the-Money (ITM), At-the-Money (ATM), Out-of-the-Money (OTM)
ITM: Favorable for the holder. Example:
- • If Nifty50 is at ₹24,600, a Call with a strike price of ₹24,500 is ITM.
- • Similarly, a Put with a strike price of ₹24,700 is ITM.
ATM: Strike price closest to the current price. Example:
• If Nifty50 is at ₹24,600, the ₹24,600 strike price is ATM.
OTM: Unfavorable for the holder. Example:
• If Nifty50 is at ₹24,600, a Call at ₹24,700 and a Put at ₹24,500 are OTM.
3. Structure of an Option Chain
An option chain is divided into two sections:
- Left Side: Call options.
- Right Side: Put options.
Each section contains the following columns:
Strike Price
The central column lists the strike prices
Open Interest (OI)
Indicates the total number of outstanding contracts
Volume
Number of contracts traded on a given day
Last Traded Price (LTP)
The last price at which the option contract was traded
Bid Price
The highest price buyers are willing to pay
Ask Price
The lowest price sellers are willing to accept
Option Greeks (Advanced Analysis)
Delta: Sensitivity to price changes in the underlying asset.
Theta: Time decay impact on the premium.
Vega: Impact of volatility on the premium.
Gamma: Rate of change of Delta.
4. Example of a Nifty50 Option Chain
Suppose Nifty50 is trading at ₹24,600. Here is a snippet of the option chain:
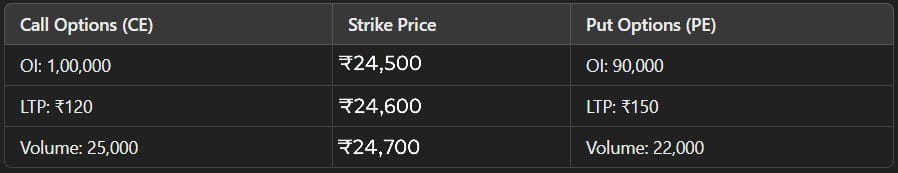
Interpretation:
- 1At ₹24,600 (current price), the strike price ₹24,600 is ATM.
- 2The Call at ₹24,500 is ITM, and the premium is ₹120.
- 3The Put at ₹24,700 is OTM, and the premium is ₹150.
5. How to Use an Option Chain?
a. Trading Strategies
Bullish View:
Buy Call Options (CE) or Sell Put Options (PE).
Example: Nifty50 is at ₹24,600, and you expect it to rise.
- Buy a ₹24,700 Call for a premium of ₹50.
- If Nifty50 rises to ₹24,800, the Call premium might increase to ₹120.
Bearish View:
Buy Put Options (PE) or Sell Call Options (CE).
Example: Nifty50 is at ₹24,600, and you expect it to fall.
- Buy a ₹24,500 Put for a premium of ₹60.
- If Nifty50 falls to ₹24,400, the Put premium might increase to ₹150.
b. Identifying Support and Resistance
Strike prices with high Open Interest (OI) often act as support or resistance levels.
Example:
- ₹24,500 Call has OI of 1,20,000 → Likely Resistance.
- ₹24,500 Put has OI of 1,10,000 → Likely Support.
c. Hedging
Use options to protect against losses.
Example:
If you own Nifty50 stocks and fear a fall, buy a Put option at ₹24,500. If the market falls, the Put will gain value, offsetting losses.
⇜PCR RATIO⇝
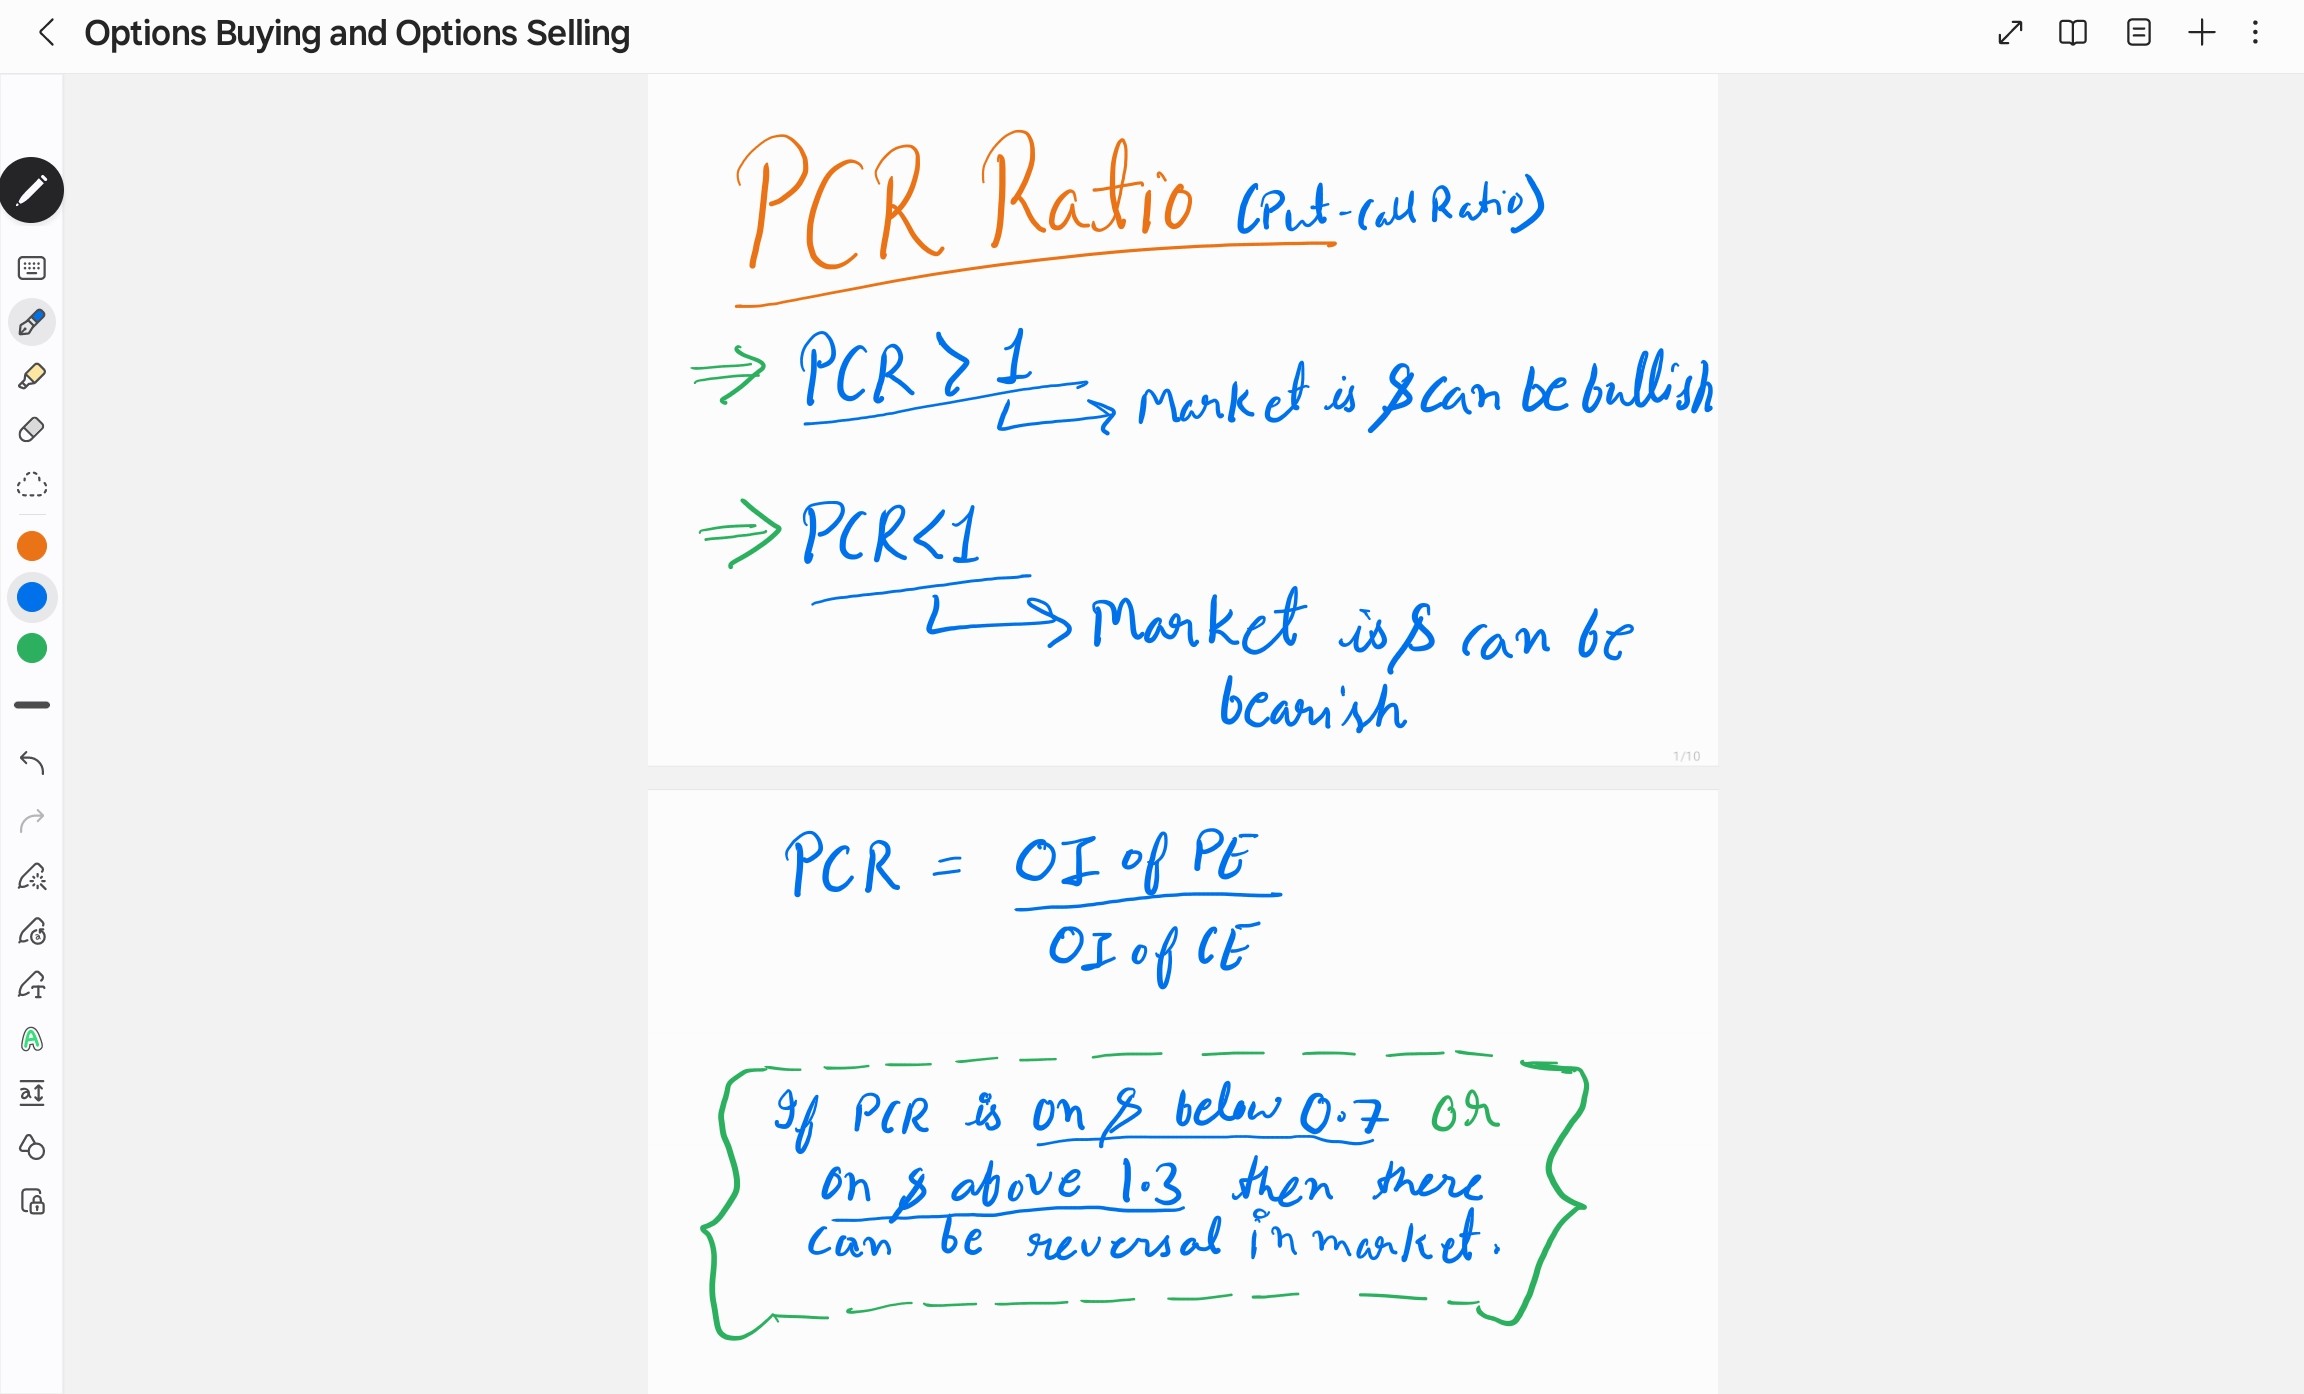
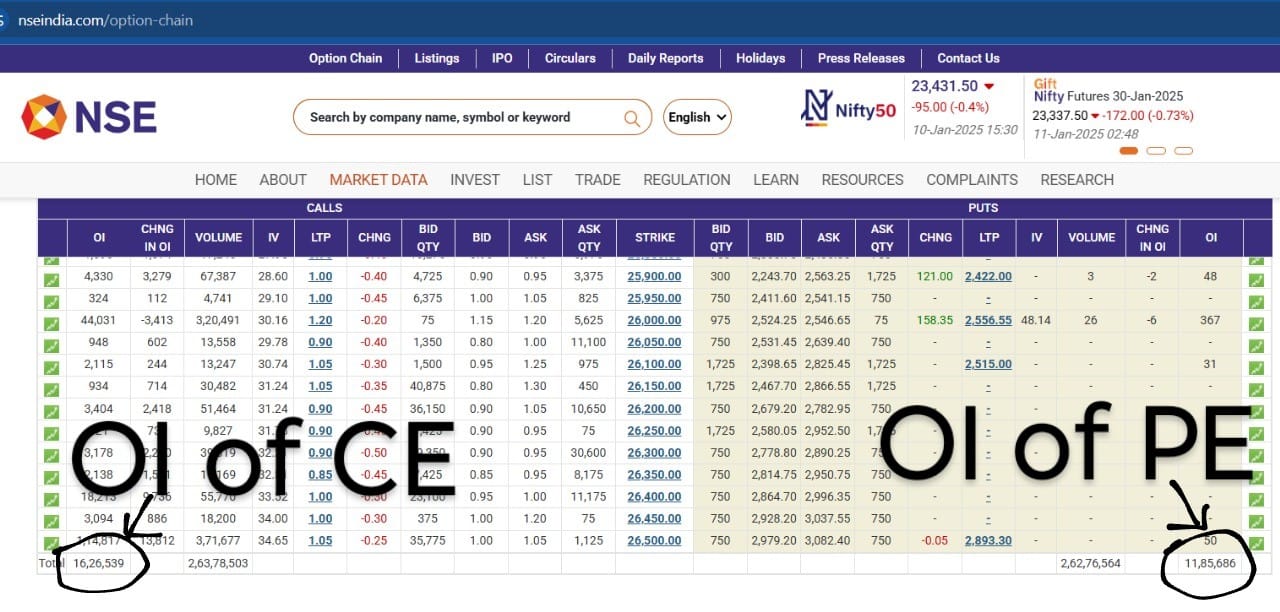
If PCR is below 0.7 then it is considered to be over sold zone and can reverse to level the market same as this if PCR is 1.3 then it is considered to be over bought zone can can reverse to level the market.